Time Profiler
Since v6.1.0/20
The Time Profiler measures the time spent during execution of a Fivetran HVR job across different processes, categorizing it into predefined categories like SQL and Network I/O. This categorization is referred to as 'time breakdown'. This collected data is then displayed in the User Interface as statistics. For more fine-grained break down per category, additional tracing can be enabled. The Time Profiler is supported for Capture job. Since version 6.1.0/37, Time Profiler is also supported for Integrate job. Since version 6.1.5/1, Time Profiler is also supported for Compare and Refresh jobs.
Time Profiler is supported for capture from all sources. For integrate, it is supported for most database targets.
Enabling Time Profiler
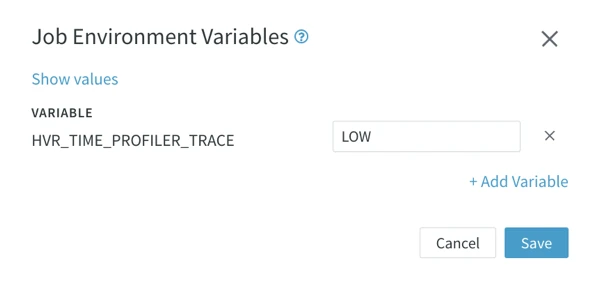
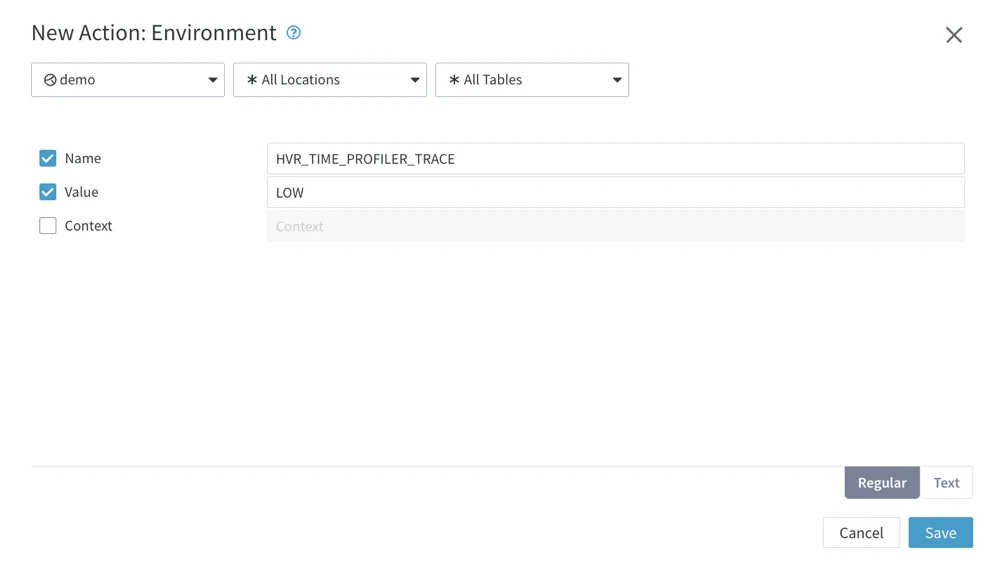
The Time Profiler is disabled by default. To enable the Time Profiler, set the environment variable HVR_TIME_PROFILER_TRACE to LOW (or higher for additional tracing) on the hub, source, and target. Then, activate the channel for which you want to enable the tracing.
To set HVR_TIME_PROFILER_TRACE on the hub, add the Job System Environment Variable for your hub:

To set HVR_TIME_PROFILER_TRACE on the source and target, add the Environment action to both locations:

Disabling Time Profiler
To disable Time Profiler, set the environment variable HVR_TIME_PROFILER_TRACE to OFF on the hub, source, and target. Then, activate the channel for which you want to disable the tracing.
Time breakdown log lines
When Time Profiler is enabled, it generates log lines after each capture or integrate cycle, displaying the timing breakdown for each category:
<Hub> Cycle timing breakdown is: FProc 0.08 seconds, Network-IO 1.02 seconds, SQL 0.00 seconds.
<Agent> Cycle timing breakdown is: FPipe 1.00 seconds, Log-scan 0.01 seconds, Network-IO 0.09 seconds.
In the example above, the hub spent 0.08 seconds while processing FProcs and 1.02 seconds on network I/O. The agent spent 1.00 seconds on FPipe processing.
Tracing
To enable additional tracing, set the environment variable HVR_TIME_PROFILER_TRACE to MEDIUM on the hub, source, and target.
Trace with a medium level of detail appears as follows:
...
$HVR_TIME_PROFILER_TRACE: <Hub> FProc(name=Get) called 74 times, 0.000s
$HVR_TIME_PROFILER_TRACE: <Agent> SQL(operation=SELECT) called: 31 times, 0.120s.
...
For more fine-grained tracing, set the environment variable HVR_TIME_PROFILER_TRACE to HIGH on the hub, source, and target.
Trace with a high level of detail appears as follows:
Instead of 'SQL' being split up per operation, 'SQL' is now also split up by 'label' and 'table'.
...
$HVR_TIME_PROFILER_TRACE: <Hub> FProc(name=Get) called 74 times, 0.000s
$HVR_TIME_PROFILER_TRACE: <Agent> SQL(operation=SELECT,label='select_curs',table='my_table') called: 26 times, 0.100s.
$HVR_TIME_PROFILER_TRACE: <Agent> SQL(operation=SELECT,label='sys_prop_cols',table='DUAL') called: 5 times, 0.020s.
...