Connections
Learn about the connections section of your Fivetran dashboard.
Overview
In the Connections section of your dashboard, you can view all the connections that sync to your destinations, add new connections, and see in-depth information about individual connections. You can also upload CSV files to your destination.
You can add multiple connections to an account. Only users who have particular user roles can add new connections. Read more about user permissions in our account management documentation.
Create a connection
Add a new connection
- In the top right corner of the Connections tab in your Fivetran dashboard, click Add connection.
- Find your source from the list or by using the search bar.
- Hover over the connector tile and click Set up.
- Find the destination from the list or by using the search bar.
- Hover over the destination tile and click Select to select it for your connection.
- Follow the detailed instructions in the embedded setup guide on the right.
- Fill in the required fields (the fields vary by source).
- Click Save & Test. Fivetran will take it from here and sync your data from your source.
Save incomplete connection setup form
If you can't fill in your entire connection setup form at one time, you can save your partially complete form and finish it later. For example, you may want to save an incomplete form if you began setting up a connection but then realized that you don't have all the information or permissions required to finish the setup.
Once you've entered the Destination schema or Destination schema prefix that defines the name of your connection, you can click Save for later to save an incomplete connection setup form at any time.
Later, you can either sort the Connections list or search the connection's name to find it again and complete the connection setup.
View connections
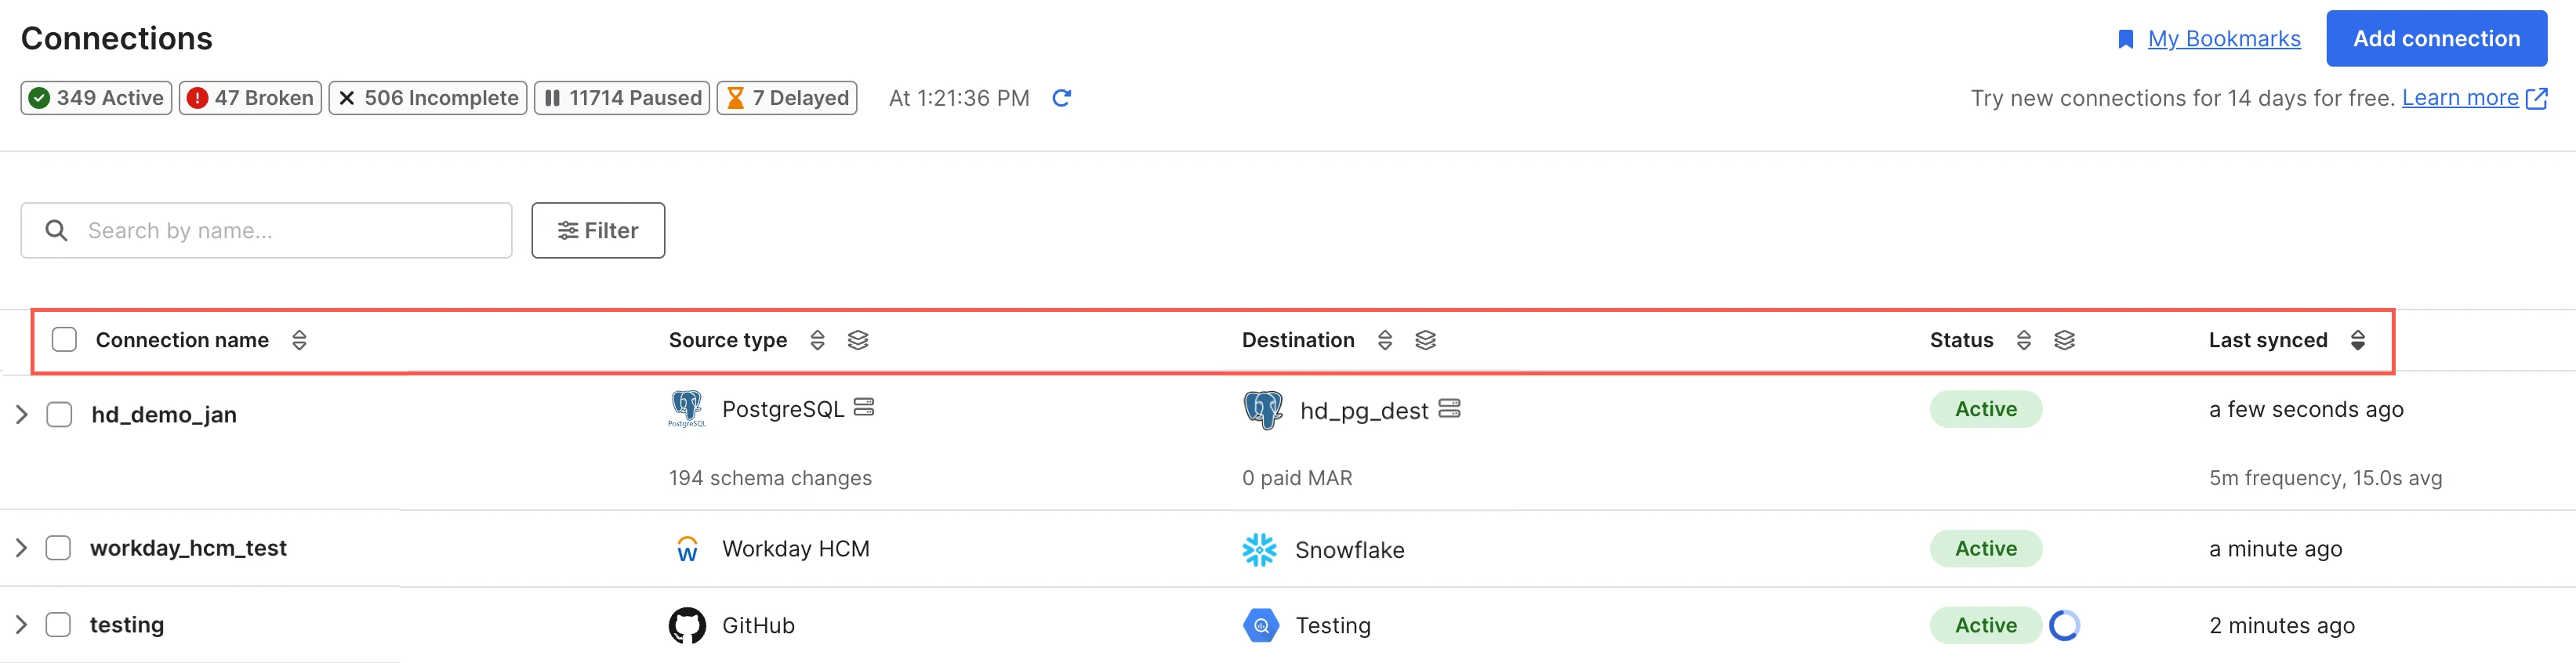
On the Connections tab, you can see the following information for each connection:
- Name: The name of your connection.
- Source: The data source that the connection syncs data from.
- Destination: The destination that the connection syncs to.
- Status: The connection's status. Learn more in the Connection status section.
- Last synced: The last time we synced the connection.
By default, your connections are ordered from the most recent sync to the least recent sync. To reorder the connections list by name, source, destination, status, or last sync time, click the column header.
You can modify the Connections list in the following ways:
- Search the connections list by connection name.
- Filter by source, destination, or status. You can apply multiple filters at the same time.
- Sort columns in ascending or descending order by clicking on the sorting icon.
- Organize the list into groups by clicking the grouping icon beside the Source, Destination, or Status column header.
- Collapse and expand groups by clicking the icon on the right from the grouping icon.
- Sort the groups by clicking the sorting icon in the grouping column.
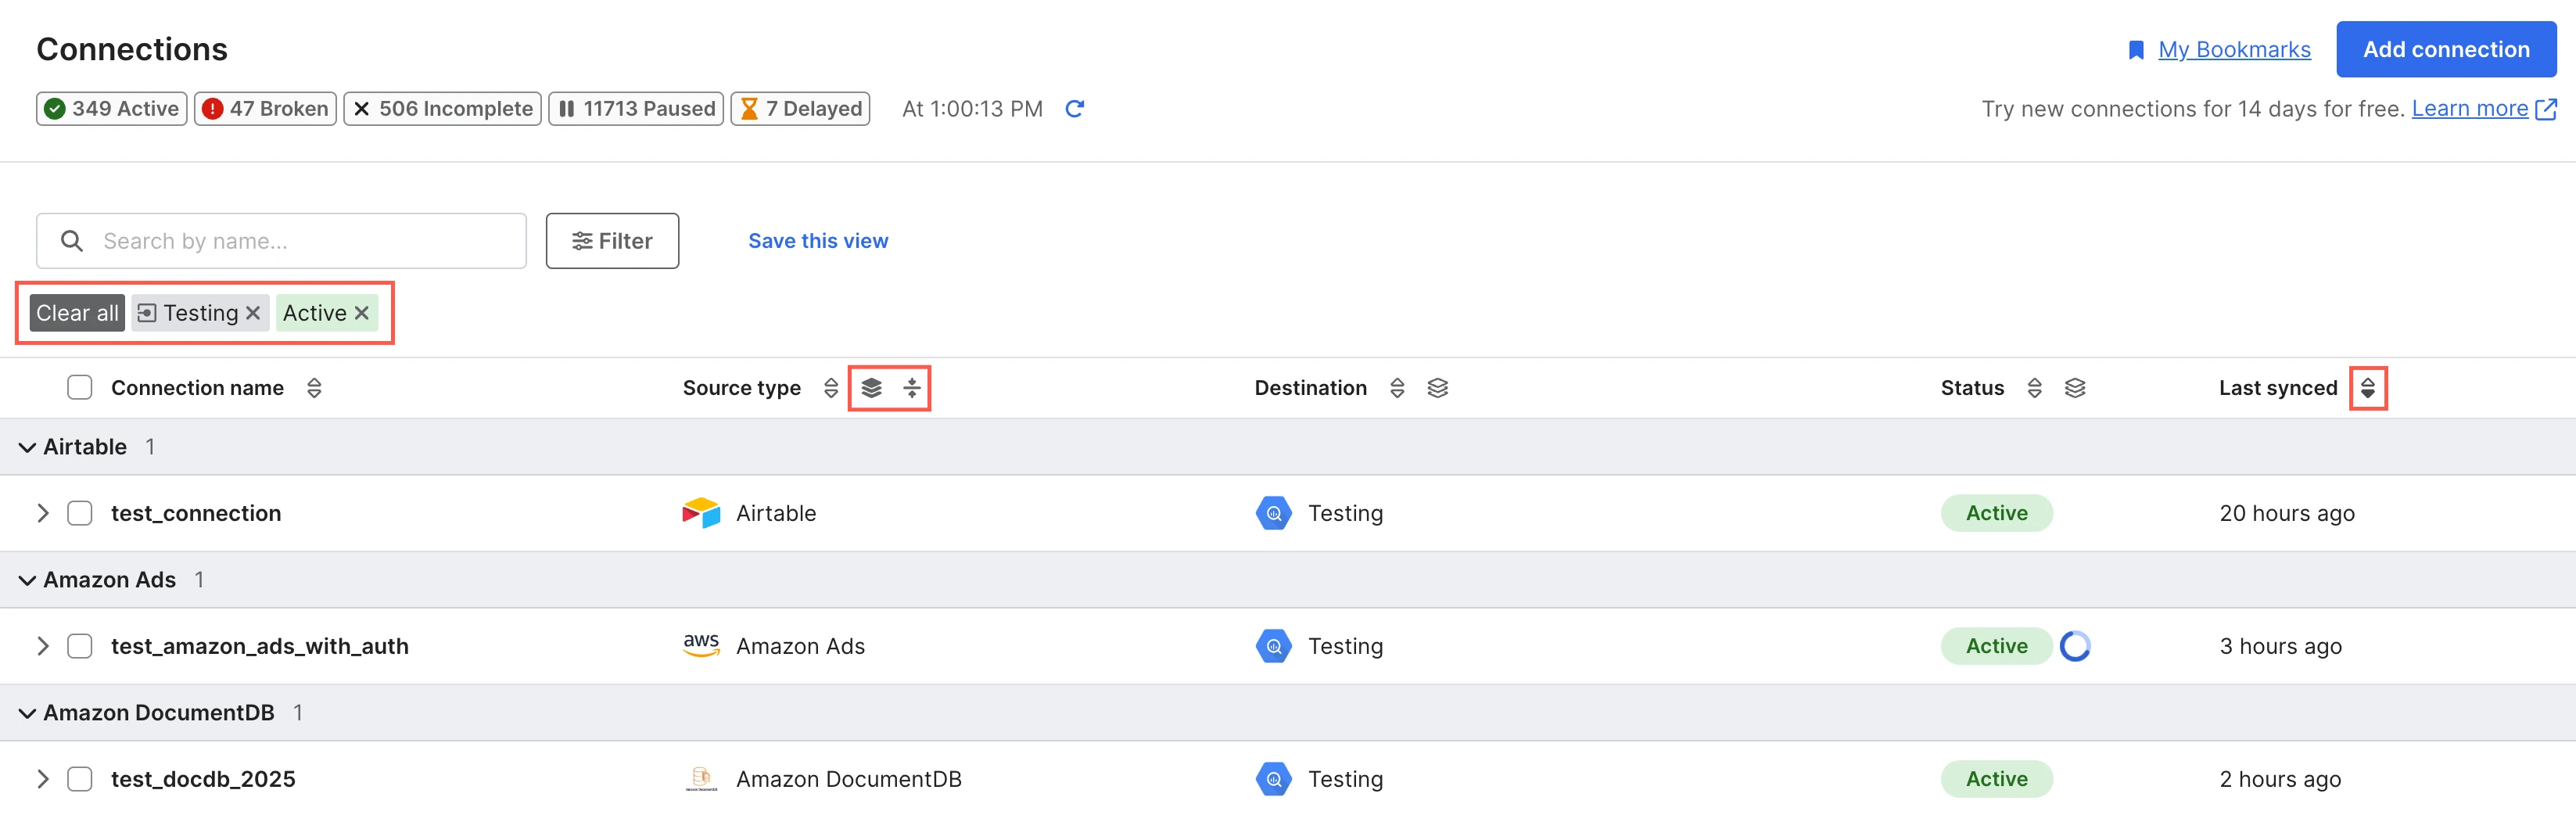
Create saved views
You can create a saved view to find connections easily.
- Filter and order the Connections list to create your chosen view.
- Above the Connections list, click Save this view. Your view is now saved.
Once you've created a saved view, you can click Go to saved view to apply your chosen settings to the Connections list at any time.
You can only have one saved view at a time. When you save a new view, it replaces the existing view.
Pin favorite connections
You can use the star icon to pin your favorite connections to the top of your Connections list for easy access. You can favorite multiple connections at the same time.
To remove a connections from your favorites, deselect the star next to its name.
Connection status
The Status column displays one of the following statuses:
- Active: The connection is actively syncing your data according to your sync schedule.
- Broken: The connection is not working because of a problem with the connection or its associated destination. To learn how to fix the problem, click the connection and read the error message in the Alerts section.
- Delayed: The connection's sync is delayed. When determining whether a connection is delayed, we now consider the average duration of its syncs, its sync frequency, and the delay notification setting you specified on your connection's Settings tab.
- Incomplete: The connection’s setup is not complete. To finish the setup, click the connection name and follow the prompts in your dashboard.
- Paused: The connections has been turned off. To unpause your connection, click the connection and set the toggle in the top right corner to ENABLED.
If you want to only view connections with certain statuses, filter the Connections list by status.
Next to your connection's status, you may see a small icon. Hover over the icon to see its description. Each icon indicates one of the following connection states:
- Syncing: The connection is currently syncing data.
- Historical: The connection is currently performing a historical sync. This could be an initial sync or a historical re-sync.
Connection details
To see and manage your connection details, select your connection from the connection list.
Connection details page has the following tabs:
Transformations tab
For the connectors that support transformations, you can view your connection's usage details on the Transformations tab of your Fivetran dashboard. Learn more in our transformations documentation.
Settings tab
On the Settings tab of your Fivetran dashboard, you can:
- View and edit your connection details
- Test the connection
- View and manage your sync schedule. Fivetran supports a fixed interval (for example, every 15 minutes) and a cron schedule for precise time-based control. Learn more in our Sync Frequency and Scheduling documentation.
- View and manage your delay threshold
- Do a historical data re-sync
- Delete the connection
- Enable or disable data checks. Data checks confirm that your source and destination values match by continually sampling and comparing about 10,000 random rows in your source and destination tables. If we detect a potential data mismatch, we investigate and reach out to you if any issues are confirmed. We recommend keeping data checks enabled. Disabling data checks reduces our ability to detect and investigate data integrity issues if they occur.
Sync troubleshooting
You can troubleshoot your connection's sync by either of the following:
- Our free Fivetran Platform Connector, which we automatically add to every destination you create.
- External log services.