Fivetran Dashboard
The Fivetran dashboard is the web-based control center for your Fivetran account. This page explains what you can do on your dashboard. The dashboard looks different based on your user permissions.
To access the Fivetran dashboard, you must have a Fivetran account that is connected to a destination. Refer to our free account trial documentation to learn how to set up your Fivetran account.
If you have a Free, Standard, Enterprise, or Business Critical account, you can also manage your Fivetran account and its connections using our REST API. See our REST API documentation for details.
Navigating the dashboard
fivetran.com/dashboard is your dashboard’s home page where you can get the overview of your account, as well as see and manage your connections, transformations, and destinations:
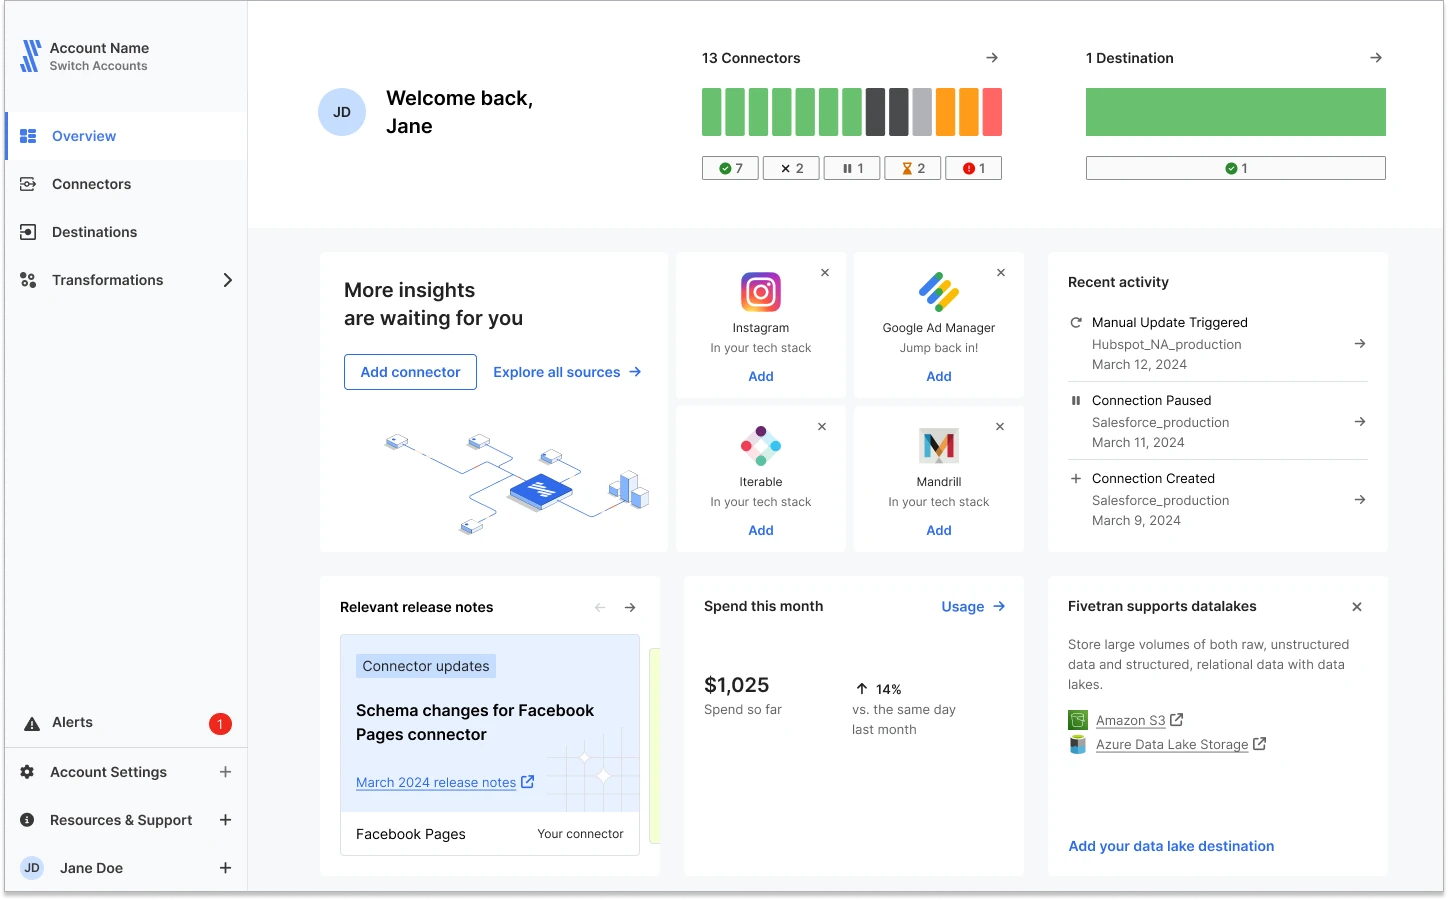
This is a screenshot from an account with multiple connections and transformations set up. Depending on how extensively you use Fivetran, as well as your role within the Fivetran account, your overview page might look differently.
Depending on your role, you can manage some or all of the following on your dashboard:
- Overview
- Statuses of your connections, destinations, and transformations
- Account insights
- Recent activity
- Release notes
- Your spend and usage
The elements on the Overview page may change over time.
- Connections
- Status - you can do following on this tab:
- View connection statistics
- Check how much of the new connection trial you have left
- View the Sync History chart
- Manually re-sync a connection
- Pause and un-pause a connection
- View the user action history log
- View connection alerts
- Enable and disable connection notifications
- Schema
- Usage
- Transformations - you can view downstream transformations associated with a connection and add Quickstart data models
- Setup - you can do the following on this tab:
- Test the connection
- View and edit your connection details
- Update sync settings, such as sync frequency, schema change settings, and delay threshold settings
- Do a historical data re-sync
- Delete the connection
- Manage email notifications
- Status - you can do following on this tab:
- Transformations
- Destinations
- Alerts
- Account Settings
- User Settings