Statistics
Since v5.31/25
Insight Statistics is a real-time, web-based dashboard which allows you to monitor replication performance. HVR's statistics dashboard helps you stay in control of your replication activity by giving you visibility into your most important data and metrics. It can display several types of statistical information such as number of rows replicated, time taken for capture and integrate, compression rates, and size of data processed on the replication system(s). The dashboard displays statistics for data updates very frequently, sometimes even on a minute-by-minute or second-by-second basis.
Stats Job
The stats job (hvrstats) generates the information required for Topology and Statistics and saves it into the catalog table (HVR_STATS) which is responsible for maintaining the statistics data. So, the stats job must be running to display live details in Topology or Statistics. The stats job is created along with the catalog tables during HVR's installation and automatically started when starting the HVR Scheduler.
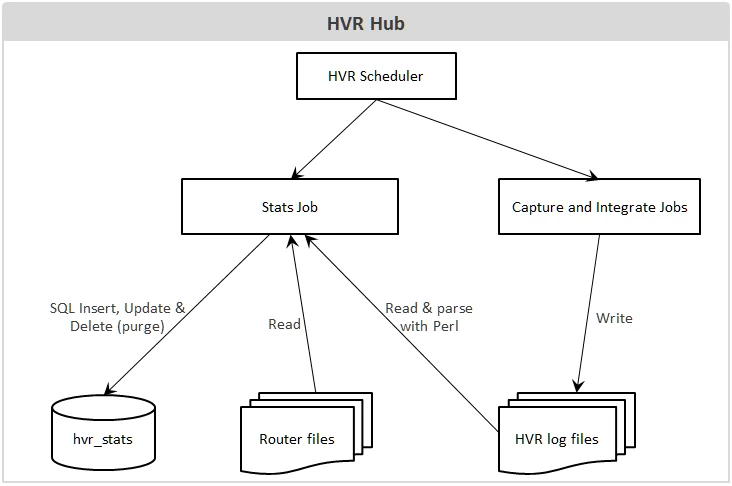
To generate the information required for Topology and Statistics,
The stats job reads data from the HVR log files and the router transaction files.
The stats job then modifies (using insert, update, and delete SQL statements) the catalog table - hvr_stats based on the data read from the HVR log files and the router transaction files. It also aggregates the statistics data that are written in the hvr_stats table.
The hvr_stats table consists of a number of columns that store statistical information about data replication. In particular, the hvr_stats table include the metric_name and metric_value columns storing data on a variety of metrics captured by HVR, such as capture/integrate latency, captured row counts, integrated change counts. For more information, see Metrics for Statistics.
Since HVR 5.7.0/17 and 5.7.5/11, by default, only the basic/important metrics that are gathered by the hvrstats job from the HVR log files. The behavior of the hvr_stats job gathering metrics can be configured by defining Scheduling /StatsMetrics.
Aggregation of Statistics Data
The stats job performs two types of aggregations (grouping) when writing statistics data to the hvr_stats table:
Scope aggregation
The metrics information received from the HVR log files are written into the hvr_stats table based on the scope defined by a channel name (column chn_name), location name (column loc_name), and table name (column tbl_name), which can be either named explicitly or regarded as '*' (which means applies to all channels, locations, tables).
For example, if there are 5 'captured inserts' with chn_name='chn1', loc_name='src' and tbl_name='tbl1' and 5 'captured inserts' with chn_name='chn1', loc_name='src' and tbl_name='tbl2'. The hvr_stats table will store these values, but it will also store value 10 for tbl_name='*', the sum of both values ('captured inserts').For more information on various scopes that can be defined, see command hvrstats option -s.
Time granularity aggregation
Metrics are gathered/output with a per-minute granularity. For example, the value of 'captured inserts' for one-minute granularity means the number of rows inserted within that minute. These values can be aggregated up to 10 minutes, 1 hour and 1 day. For more information on the time granularity, see command hvrstats option -T.
Statistics History Retention
By default, the old statistics data in the hvr_stats table is purged automatically to save the disk space needed for the hub database. The default statistics history retention size is MEDIUM (described in Scheduling /StatsHistory).
To change default statistics history retention size, define action Scheduling /StatsHistory.
To purge the statistics data immediately (as a one-time purge) from the hvr_stats table, use the command hvrstats (option -p).
Viewing Stats Job and Stat Job Log
In HVR GUI, the stats job is displayed under the Scheduler node.
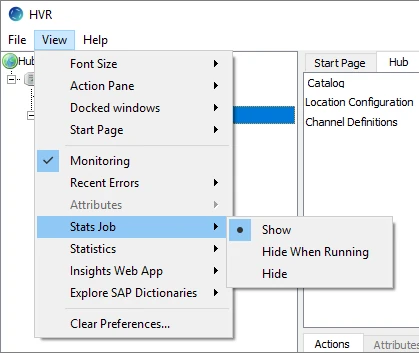
By default, if the stats job is running, it is not displayed under the Scheduler node. The display settings for the stats job can be configured from the menu bar.
In the menu bar, click View▶ Stats Job▶Show, to always display the stats job under the Scheduler node.
To view the stats job log, right-click the {hvrstats} and select View Log.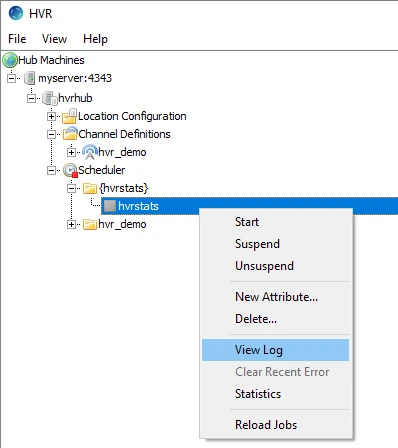
Launching Statistics from HVR GUI
Statistics can be launched only from HVR GUI, and it can only be viewed within the Insights interface in a web browser.
Click here - Settings for Viewing Insights
Settings for Viewing Insights
The Insights interface for Topology, Statistics, and Events can be viewed only in the web browser.
Following are the two available options that can be configured (View ▶ Insights Web App) for viewing the Insights interface:
Open in local web browser (default) - Automatically open the respective Insights interface in the default web browser.
When this option is used and if the URL is shared with other users, only the users who are connected to the machine on which the HVR GUI is executed can access the Insights interface.
Show URL only - A prompt is displayed with an option to copy the Insights URL, which can be then pasted into any web browser's address bar to view the respective Insights interface. This option is used in any of the following situations:
To launch Statistics, right-click Scheduler an select Statistics.
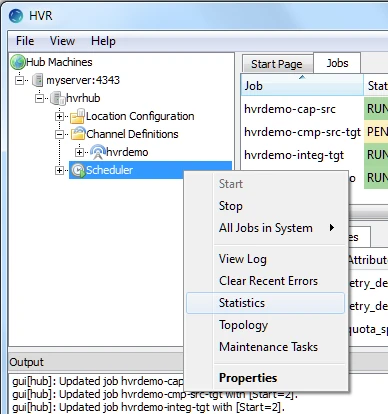
To launch Statistics, when the viewing option for Insights Web App is set to Show URL only, the following needs to be performed:
Right-click Scheduler and select Statistics
Click Copy to Clipboard.

Paste the URL in the web browser's address bar and press Enter.
Statistics View
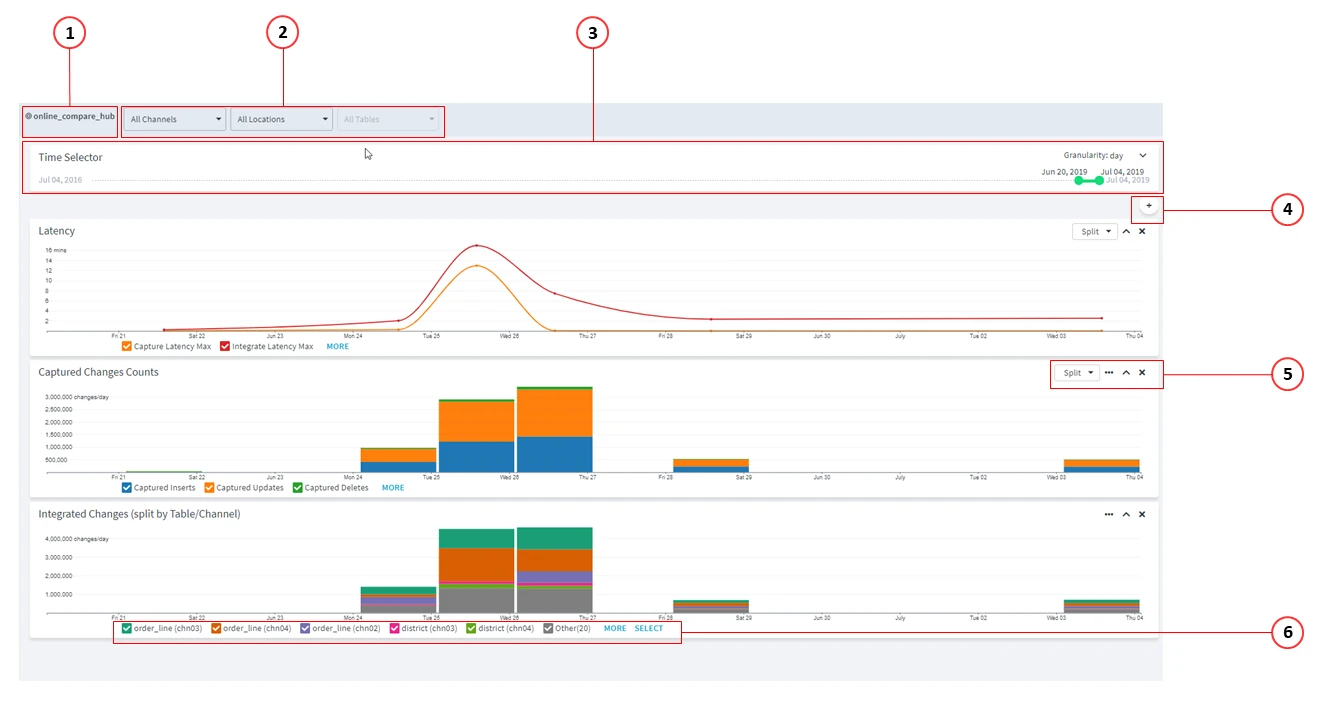
The Statistics view contains the following user interface components:
Hub - name of the hub for which the statistics is displayed.
Scope - filter the dashboard based on the selected location, channel, or table.
Time Selector - filter the dashboard based on the selected start date/time and end date/time. The other method to select time range is to zoom in on a custom time range on the graph. Click-and-drag the mouse across the chart to select a time range. The newly selected time range is applied to all graphs available in the dashboard. For example, to view statistics from 25th to 27th June, click-and-drag the mouse across the chart as shown below.

Granularity - Sets the aggregation of data for the dashboard. The granularity of time refers to the size in which data fields are sub-divided. The default granularity is an hour. However, this aggregation can be changed to a 'fine granularity' level like 1 minute or to a 'coarse granularity' level like 1 day. Changing the granularity is immediately reflected in the x-axis of all charts displayed in the dashboard. Finer granularity has overheads like excess computation time, memory, or other resources that are required to generate statistics dashboard. For this reason the data stored for each granular level is limited/purged at certain point of time - Scheduling /StatsHistory.
The available options are -
minute: Indicates 1-minute granularity. The period displayed in the Time Selector is limited to the last 14 days.
10 min: Indicates 10-minute granularity. The period displayed in the Time Selector is limited to the last 30 days.
hour: Indicates 1-hour granularity. The period displayed in the Time Selector is limited to the last 6 months.
day: Indicates 1-day granularity. The period displayed in the Time Selector is limited to the last 3 years.
Add Graph- Add graph to the dashboard. For information about the available graphs in Statistics, see section Graphs.
Options to customize each graph.
- Split: create a graph using the selected graph's Metric and Scope (Location, Channel, or Table and Channel). In Split drop-down, you can select a Metric available in the graph and split it by Scope. The split graph will be inserted next to the graph containing a metric you want to split.
- Rate unit: change the Y-axis unit (per second, per minute, per hour, or per day). By default, the rate unit matches the Granularity: per minute for minute and 10 minute granularity, per hour for hour granularity and per day for day granularity.
- Λ: Expand/collapse graph (when collapsed, only the graph header is displayed).
- X: Remove graph from the dashboard.
Legend/Metrics - Indicates the metrics for graph. Each graph displays different metrics. For more information about metrics displayed in Statistics, see Metrics for Statistics.
- MORE: displays more metrics in the graph.
- LESS: displays less metrics.
- SELECT: allows you to select particular metrics that needs to be displayed in a graph. This option is displayed only when a graph has more than 5 metrics associated with it.
Graphs in Statistics
The dashboard contains a set of graphs that indicate the state of different aspects of the replication. Following are the default graphs displayed in Statistics:
| Graph Name | Description |
|---|---|
| Latency | Displays the latency information for capturing and integrating changes. Latency is the time (in seconds) taken for a transaction committed on the source system to be replicated (or committed) on the target system. This graph allows you to analyze the delay in data replication. The following Latency Stats Metrics are displayed in this graph:
|
| Captured Changes Counts | Displays the total number of changes captured. The following Captured Row Counts Stats Metrics are displayed in this graph:
|
| Integrated Changes (split by Table/Channel) | Displays the total number of changes integrated. This is basically a Integrated Change Counts graph which is split using the metric Integrated Changes and scope Table/Channel. |
The following graphs can be added by clicking on the Add Graph button.
| Graph Type | Description |
|---|---|
| Integrated Change Counts | Displays the total number of changes integrated. The following Integrated Change Counts Stats Metrics are displayed in this graph:
|
| Transactions | Displays the total number of transactions. The following Transactions Stats Metrics are displayed in this graph:
|
| Durations | Displays the time taken for replication in seconds. The following Duration Stats Metrics are displayed in this graph:
|
| Speed | Displays the speed of replication. The unit of speed is indicated by the number of captured and integrated rows per selected granularity of time. The following Speed Stats Metrics are displayed in this graph:
|
| Cycles | Displays the number of Capture and Integrate cycles. The following Cycles Stats Metrics are displayed in this graph:
|
| Byte I/O | Displays the size of captured row data and files in bytes before and after compression. The following Byte I/O Stats Metrics are displayed in this graph:
|
| Compression | Displays the compression ratio for row data. Captured row data is compressed when sent from the capture location to the hub and from the hub to the integrate location. The following Compression Stats Metrics are displayed in this graph:
|
| Replicated Files | Displays the number of rows captured and integrated into file locations. The following Replicated Files Stats Metrics are displayed in this graph:
|
| Errors/Warnings | Displays the total number of errors and warnings. The following Errors/Warnings Stats Metrics are displayed in this graph:
|
| Router Rows | Displays the total number of rows in the transaction files. The following Router Rows Stats Metrics are displayed in this graph:
|
| Router Bytes | Displays the total size of the transaction files in bytes. The following Router Bytes Stats Metrics are displayed in this graph:
|
| Router Files | Displays the total number of transaction files. The following Router Files Stats Metrics are displayed in this graph:
|