Topology
Since v5.5.5/6
HVR's Topology view provides a real-time, web-based graphical visualization of how the source and target locations are connected using channels defined in HVR. It also graphically represents various elements in replication like source and target locations, volume of data in each locations, channels involved in replication, direction of replication, volume of replication, latency in replication, and problems like latency threshold exceeded or job failure etc. This helps to see at a glance where trouble lies in the replication: locations and channels displayed in the Topology view are color-coded based on the data volume and latency. Locations or channels alerting red can be immediately clicked into for diagnosis and troubleshooting.
In Topology, a specific location or channel can be selected to view the statistics related to that specific selection. For more information, see section Live Status Card.
Stats Job
The stats job (hvrstats) generates the information required for Topology and Statistics and saves it into the catalog table (HVR_STATS) which is responsible for maintaining the statistics data. So, the stats job must be running to display live details in Topology or Statistics. The stats job is created along with the catalog tables during HVR's installation and automatically started when starting the HVR Scheduler.
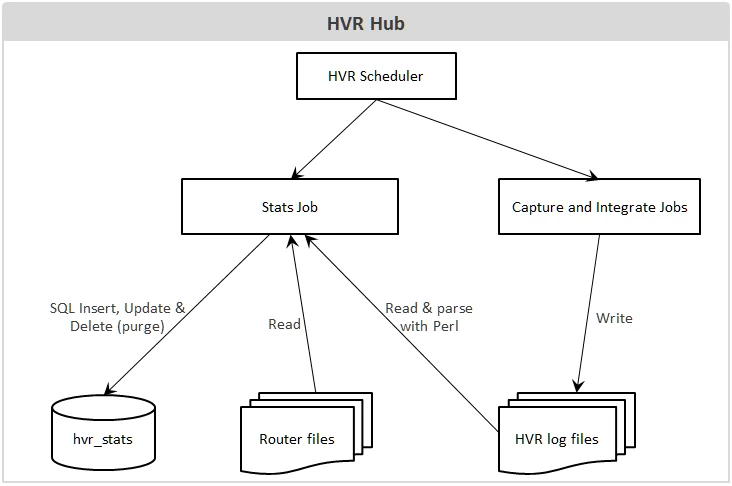
To generate the information required for Topology and Statistics,
The stats job reads data from the HVR log files and the router transaction files.
The stats job then modifies (using insert, update, and delete SQL statements) the catalog table - hvr_stats based on the data read from the HVR log files and the router transaction files. It also aggregates the statistics data that are written in the hvr_stats table.
The hvr_stats table consists of a number of columns that store statistical information about data replication. In particular, the hvr_stats table include the metric_name and metric_value columns storing data on a variety of metrics captured by HVR, such as capture/integrate latency, captured row counts, integrated change counts. For more information, see Metrics for Statistics.
Since HVR 5.7.0/17 and 5.7.5/11, by default, only the basic/important metrics that are gathered by the hvrstats job from the HVR log files. The behavior of the hvr_stats job gathering metrics can be configured by defining Scheduling /StatsMetrics.
Aggregation of Statistics Data
The stats job performs two types of aggregations (grouping) when writing statistics data to the hvr_stats table:
Scope aggregation
The metrics information received from the HVR log files are written into the hvr_stats table based on the scope defined by a channel name (column chn_name), location name (column loc_name), and table name (column tbl_name), which can be either named explicitly or regarded as '*' (which means applies to all channels, locations, tables).
For example, if there are 5 'captured inserts' with chn_name='chn1', loc_name='src' and tbl_name='tbl1' and 5 'captured inserts' with chn_name='chn1', loc_name='src' and tbl_name='tbl2'. The hvr_stats table will store these values, but it will also store value 10 for tbl_name='*', the sum of both values ('captured inserts').For more information on various scopes that can be defined, see command hvrstats option -s.
Time granularity aggregation
Metrics are gathered/output with a per-minute granularity. For example, the value of 'captured inserts' for one-minute granularity means the number of rows inserted within that minute. These values can be aggregated up to 10 minutes, 1 hour and 1 day. For more information on the time granularity, see command hvrstats option -T.
Launching Topology from HVR GUI
Topology can only be launched from HVR GUI, and it can only be viewed within the Insights interface in a web browser.
Click here - Settings for Viewing Insights
Settings for Viewing Insights
The Insights interface for Topology, Statistics, and Events can be viewed only in the web browser.
Following are the two available options that can be configured (View ▶ Insights Web App) for viewing the Insights interface:
Open in local web browser (default) - Automatically open the respective Insights interface in the default web browser.
When this option is used and if the URL is shared with other users, only the users who are connected to the machine on which the HVR GUI is executed can access the Insights interface.
Show URL only - A prompt is displayed with an option to copy the Insights URL, which can be then pasted into any web browser's address bar to view the respective Insights interface. This option is used in any of the following situations:
To launch Topology, right-click Scheduler and select Topology.
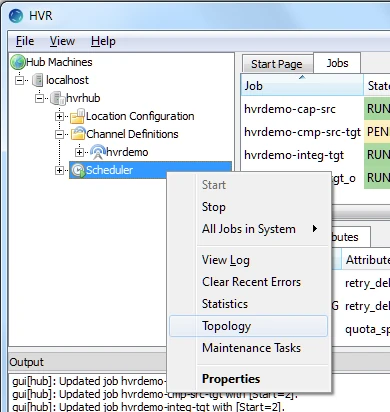
To launch Topology when the viewing option for Insights Web App is set as Show URL only, the following needs to be performed:
Right-click Scheduler and select Topology
Click Copy to Clipboard.

Paste the URL in the web browser's address bar and press Enter.
Topology View
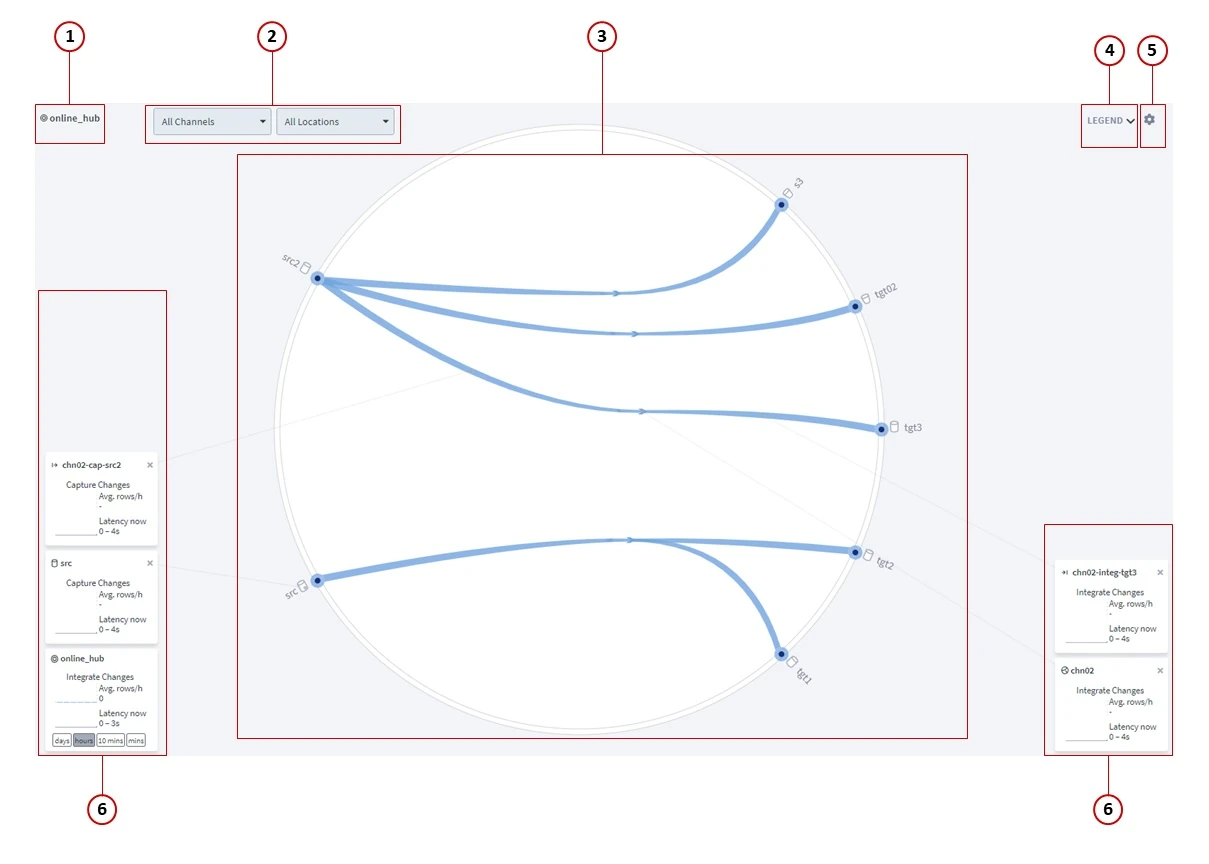
The Topology view contains the following user interface components:
- Hub - name of the hub for which the topology is displayed.
- Scope - highlights the selected location or channel in the topology. This is same as clicking on a location or channel.
- Topology - graphical representation of locations, channel, direction of replication, volume of data in locations, volume of data being replicated, and latency in replication.
- Legend - show/hide description for the colors and icons displayed in topology.
- Settings - show/hide configuration for the topology view.
- Live status card - displays the performance metrics for the respective element selected in topology. For more information, see Live Status Card.
Live Status Card
Live status card displays the live statistics metrics for the elements selected in topology. Live status card is supported for the following elements - Hub, Channel, Source Location, Capture Job, Integrate Job, and Integrate Location. By default, only the live status card for Hub is displayed in the Topology view. The statistics displayed in the live status card can be filtered based on the granularity (days/hours/10 mins/mins) selected. The default granularity is an hours.
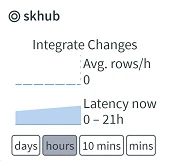
Only two metrics can be displayed at a time in live status card and this can be configured from Settings → Visible metrics.
Clicking on the live status card opens statistics view for the respective element.
Settings
The settings screen allows you to configure/customize the topology view.
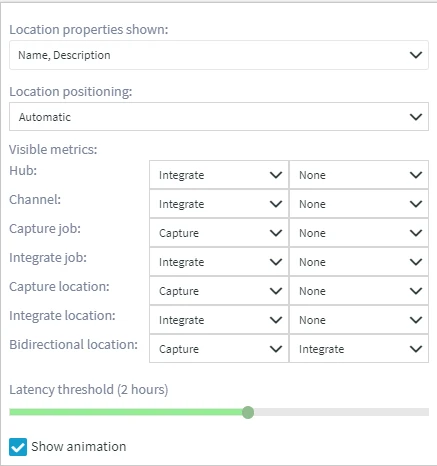
The options available in settings screen are:
| Settings | Options |
|---|---|
| Location properties shown | Configure the location properties to be displayed next to a location icon. Only the option selected first is displayed and the remaining are only visible on mouse hover. Options available are:
|
| Location positioning | Configure the visual layout of locations over left and right edges of the Topology area (source and target locations respectively). Options available are:
|
| Visible metrics | Configure the metrics to be displayed in live status card for the following elements (Hub, Channel, Capture Job, Integrate Job, Capture Location, Integrate Location, Bidirectional Location) of replication:
|
| Latency threshold | Slider to configure the threshold for latency. |
| Show animation | Show/hide animation for data movement in channel. |
Icons in Topology
In the Topology view, elements involved in replication are represented by various icons.
| Icon | Description |
|---|---|
| Indicates HVR hub. | |
| Indicates channel. | |
| Indicates database location. | |
| Indicates file location. | |
| Indicates Kafka location. | |
| Indicates capture job. | |
| Indicates integrate job. | |
| Indicates the direction of replication. The color of this icon turns red if a job failed or the latency threshold is exceeded. |