Local Testing
The Connector SDK's debug tool, Fivetran Local Tester, emulates Fivetran’s core locally, allowing you to validate your connector’s behavior, inspect output data, and catch issues early, before deploying or debugging production syncs. Run your connector locally against real source data, verify the results, and refine your implementation.
Run your connector locally
Run a local debug session from a terminal or directly from your IDE.
Option 1: In the terminal, navigate to the directory containing your
connector.pyfile and run:fivetran debugTo test the connector locally with configuration values specified in
configuration.json, pass it as an argument:fivetran debug --configuration configuration.jsonSee our CLI Commands documentation for more details about the
fivetran debugcommand.Option 2: If you prefer to run debug from your IDE, include the following snippet in
connector.py:if __name__ == "__main__": connector.debug()
For a walkthrough of testing your connector locally, see the Test the connector locally step in our Beginner's tutorial.
What to expect
A successful debug run produces output showing sync statistics — upserts, updates, deletes, truncates, schema changes, and checkpoints.
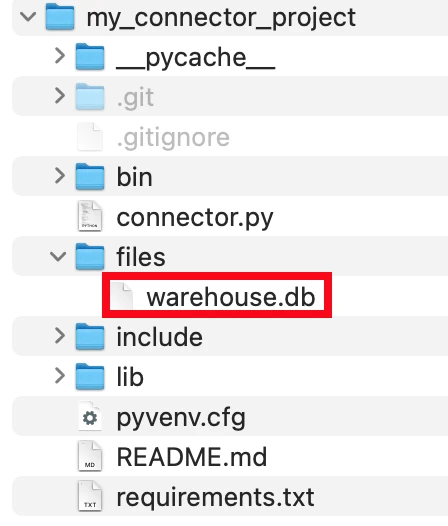
After a successful run, the Local Tester generates a local warehouse.db file, a DuckDB representation of the data delivered by the connection to the destination at <project directory>/files/warehouse.db. You can use this file to inspect and validate your connector output during development.
Expand to see an example debug log
The test also outputs a log in the terminal where you ran the command or the built-in terminal in your IDE. The final lines of the debug log look similar to this example:
   Apr 11, 2025 01:28:06 PM: INFO ⚡ debugger: SYNC PROGRESS:

   Operation     | Calls
   ------------- + ------------
   Upserts       | 44
   Updates       | 0
   Deletes       | 0
   Truncates     | 0
   SchemaChanges | 1
   Checkpoints   | 1

   Apr 11, 2025 01:28:06 PM: INFO ⚡ debugger: Sync SUCCEEDED
For more examples of Local Tester logs, see the Connector SDK technical reference.
Inspect the warehouse.db file
After running fivetran debug, validate that your connector is working correctly by inspecting the generated data in warehouse.db.
You can open warehouse.db using any of the following tools or another tool of your choice.
DuckDB CLI
Expand to see steps
Run DuckDB CLI:
duckdb files/warehouse.dbOnce running, you can see the tables and their schema as well as query the warehouse with SQL:
.tables
.schema
SELECT * FROM default_schema.hello_world;
To stop DuckDB, run the following command:
.exit
DuckDB UI
Expand to see steps
Navigate to your project root directory.
Start the DuckDB UI by running:
duckdb files/warehouse.db -uiThis starts a local HTTP server and prints a URL, such as
http://localhost:4213/. The DuckDB UI opens automatically in your default browser.In the UI:
- Expand Attached databases to browse schemas and tables created during your local
fivetran debugrun. - Create notebooks and execute SQL queries interactively to inspect your connector's debug output. Here's a sample screenshot of DuckDB UI connected to a
warehouse.dbfile: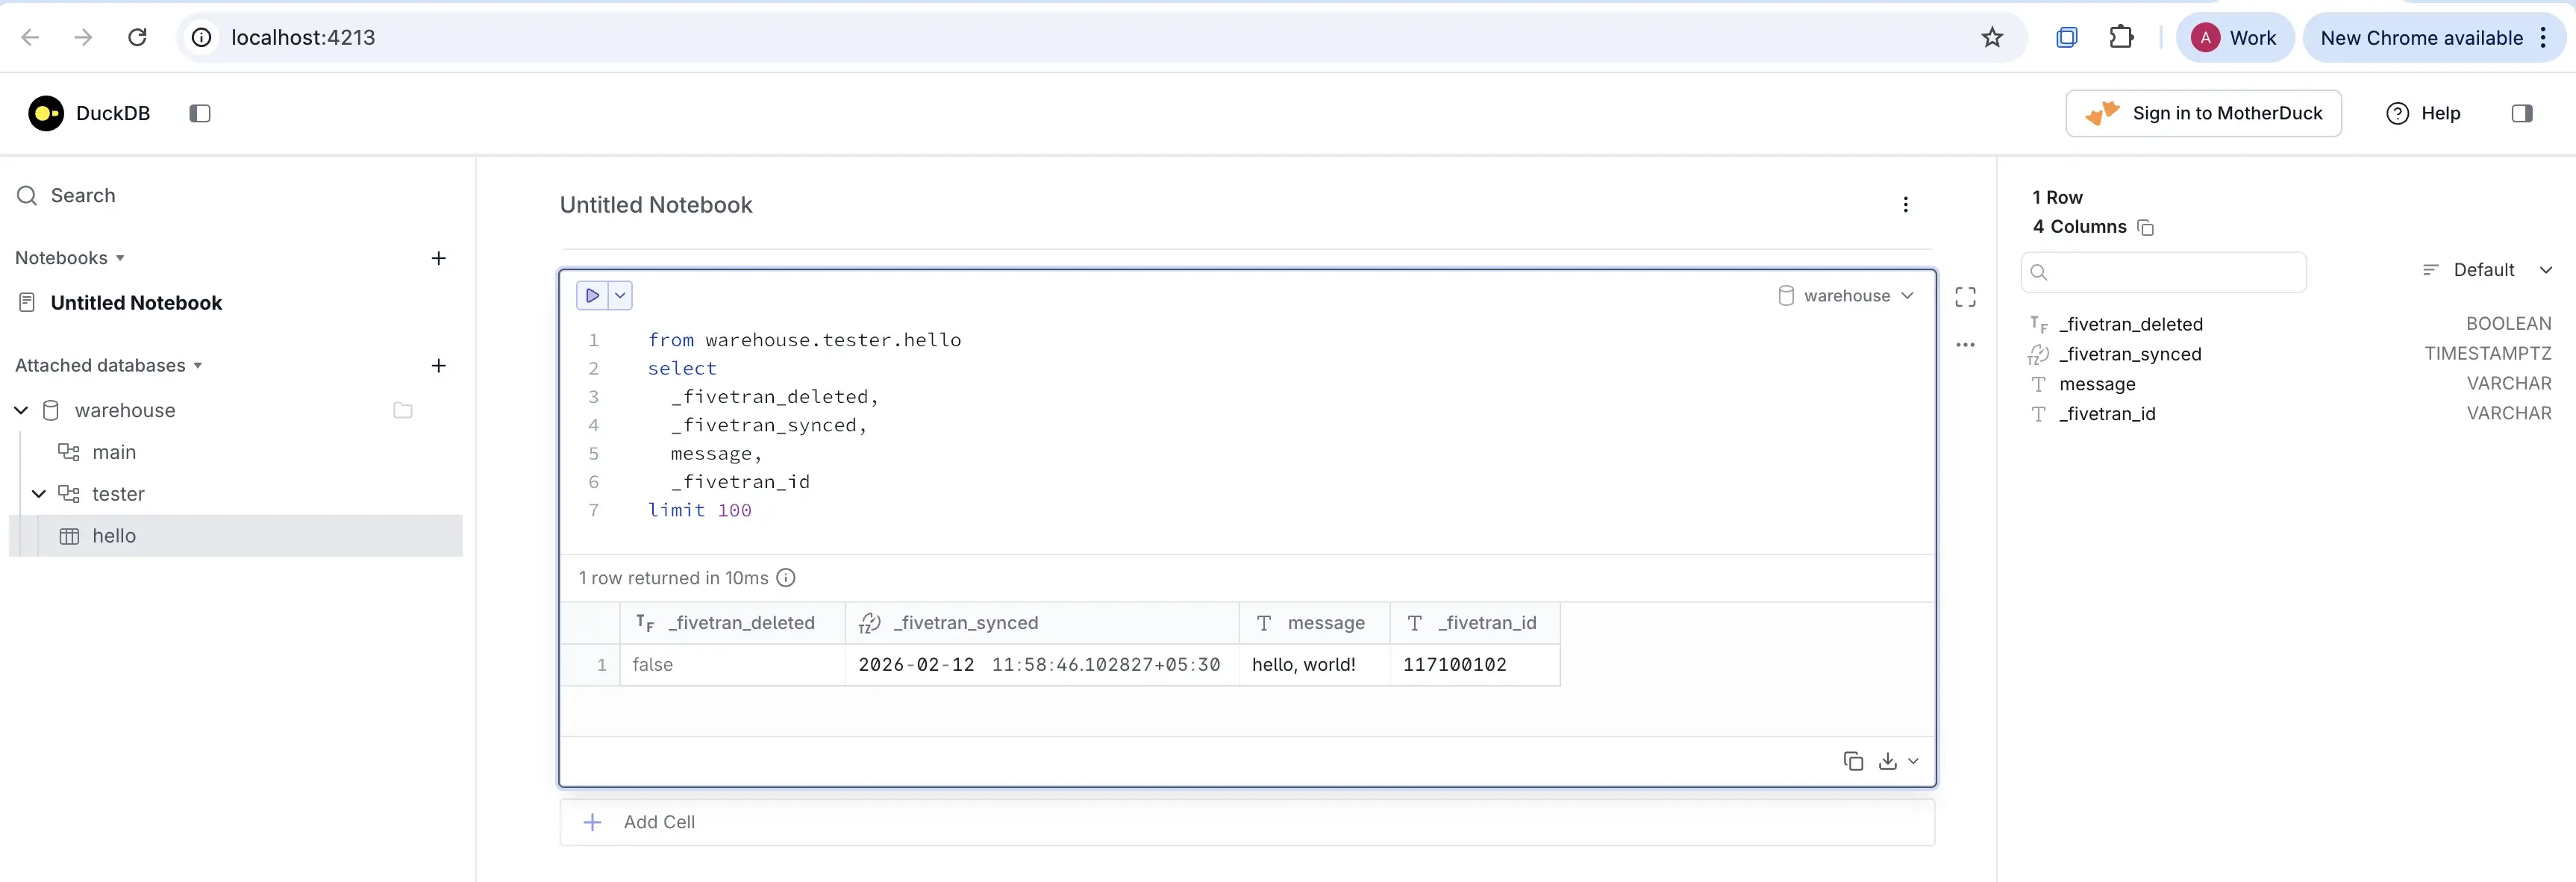
- Expand Attached databases to browse schemas and tables created during your local
To stop DuckDB UI, close the browser tab and interrupt the terminal process by pressing
Ctrl + Cor type.exit.
For more information about the UI extension and advanced configuration options, see the official DuckDB UI extension documentation.
DBeaver
Expand to see steps
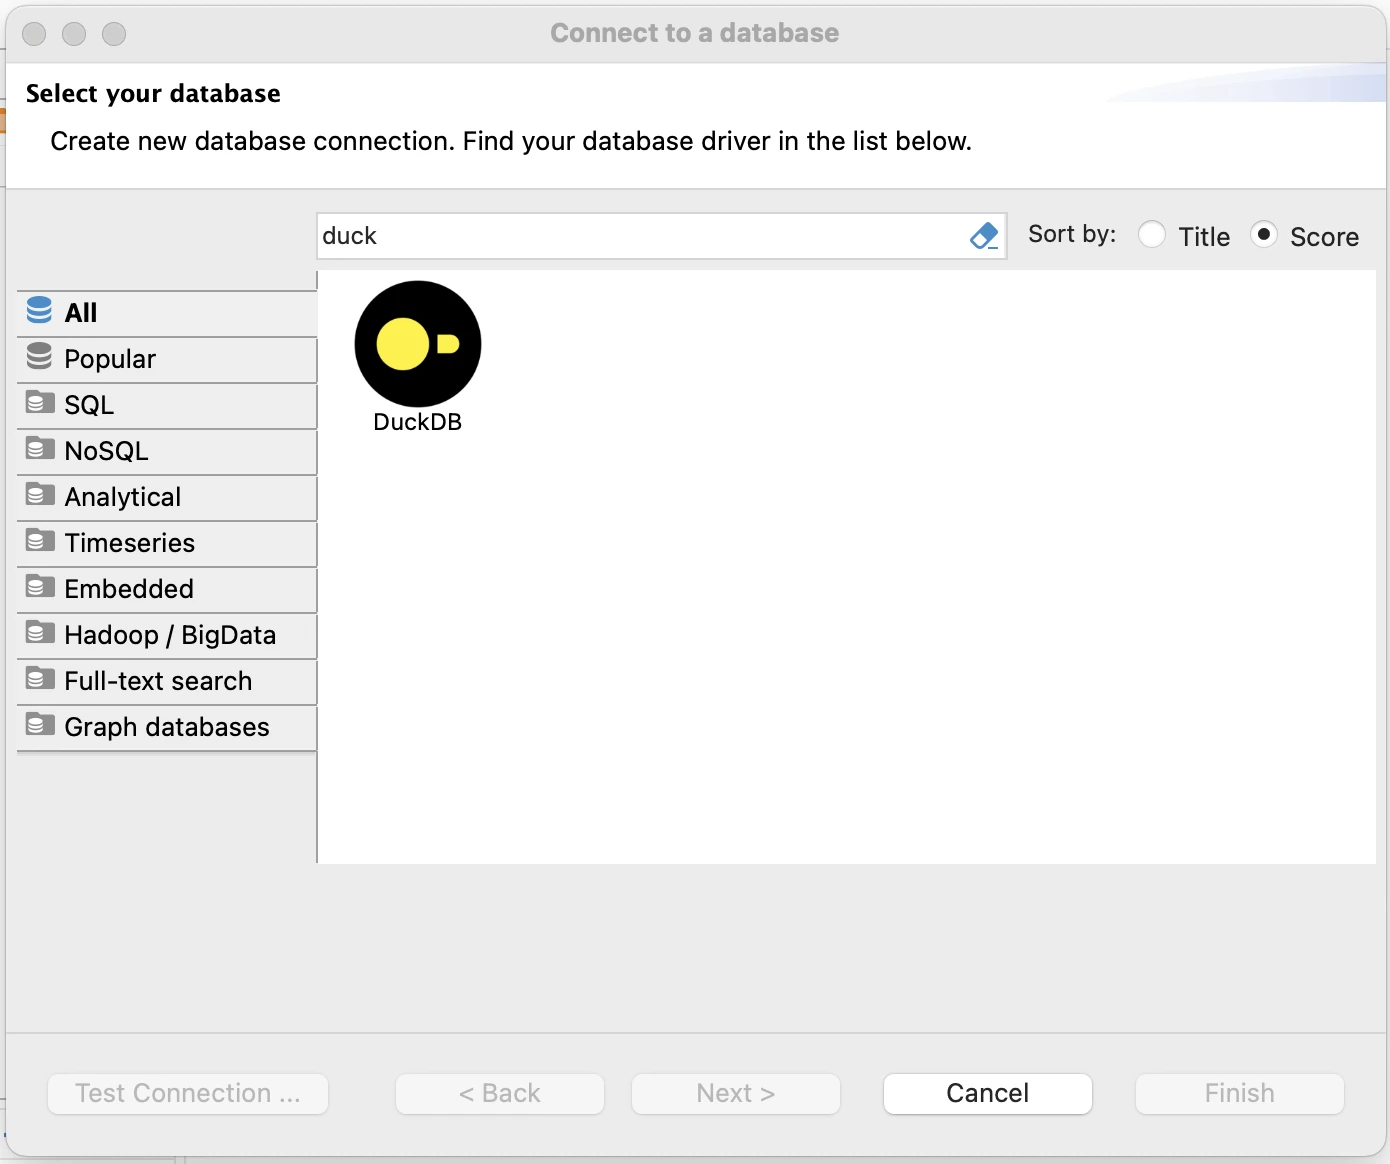
To connect to a database, in the DBeaver menu go to Database > New Database Connection and select DuckDB.
Click Open to navigate to and select the
warehouse.dbfile created by runningfivetran debug.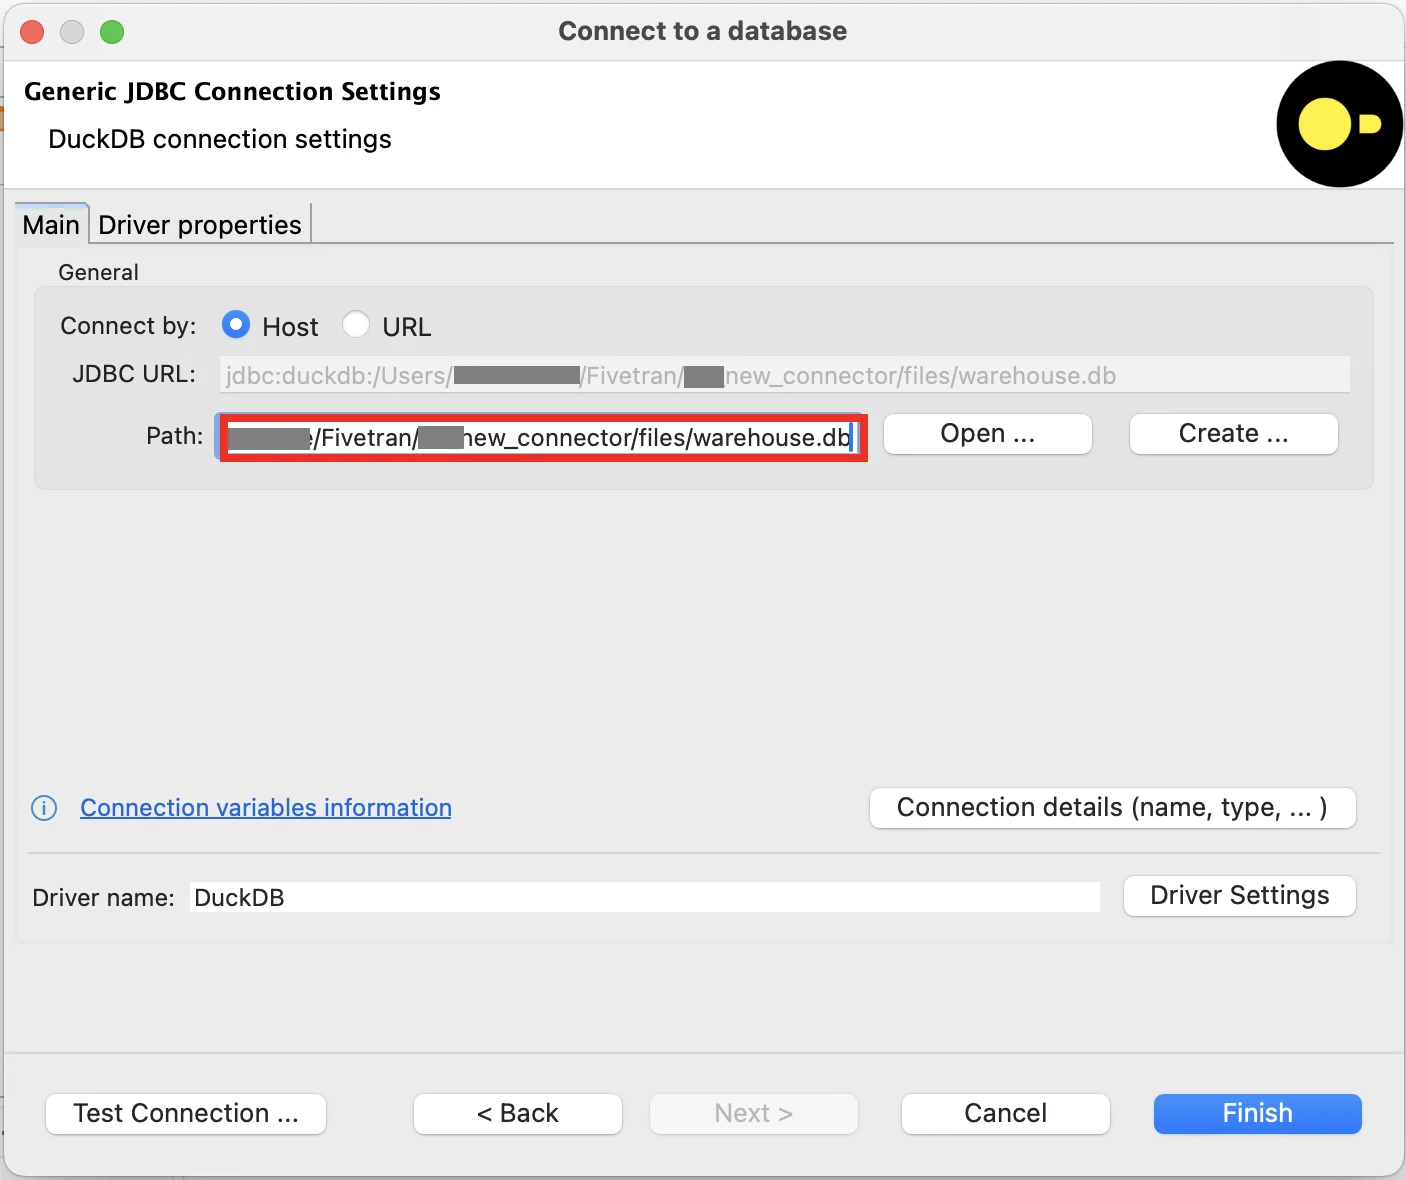
Click Connection details (name, type, ...) if you wish to provide a custom name to the connection.
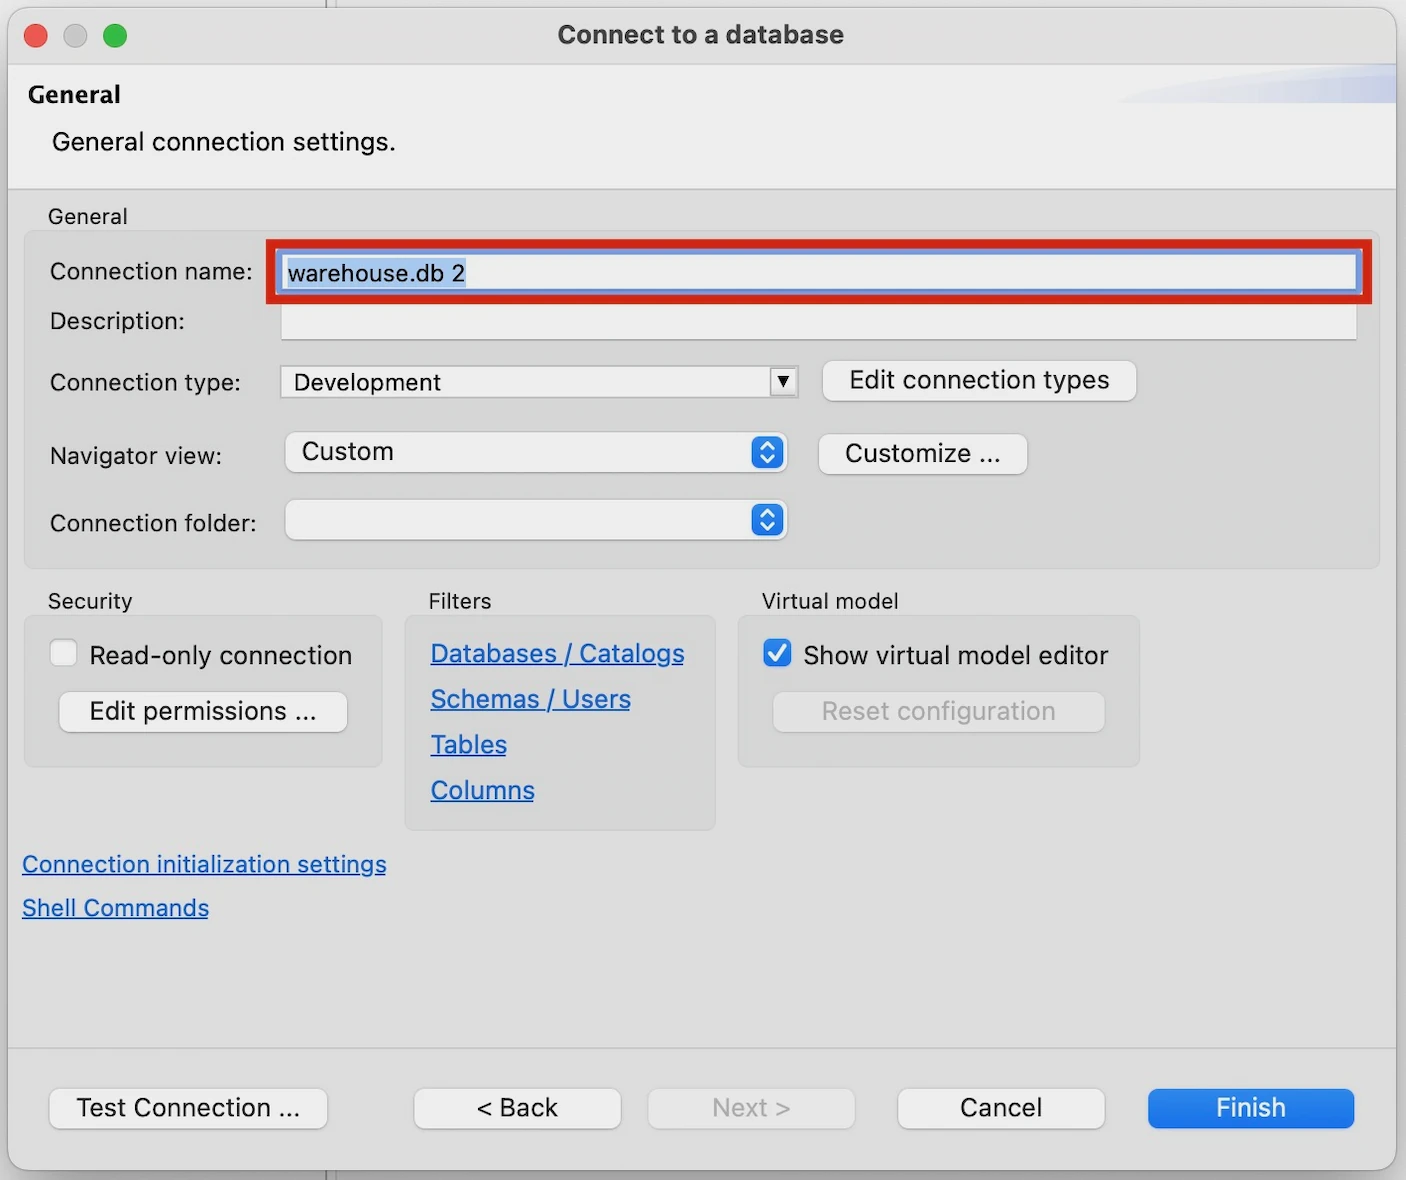
DBeaver may need to download updated drivers, then show that it's connected to the local
warehouse.dbfile, and enable you to explore it using regular SQL. Your tables will be located in thetesterschema of thewarehousecatalog.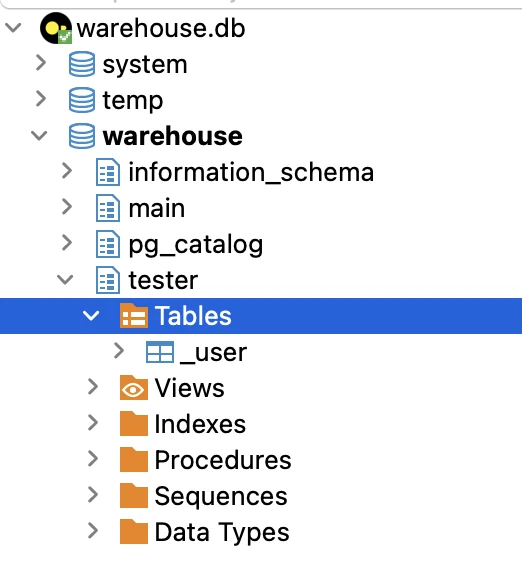
DuckDB allows only one process to connect to warehouse.db at a time. Before running fivetran debug again, close your DBeaver connection to the file.
Harlequin CLI
Expand to see steps
pip install harlequinRun Harlequin with your warehouse.db with:
harlequin "path/to/warehouse.db"Replace
path/to/warehouse.dbwith the path to yourwarehouse.dbfile.Once running, you can see the data catalog and their schema as well as query the warehouse with SQL:
SELECT * FROM tester.hello;Here is a sample screenshot of Harlequin connected to a
warehouse.dbfile: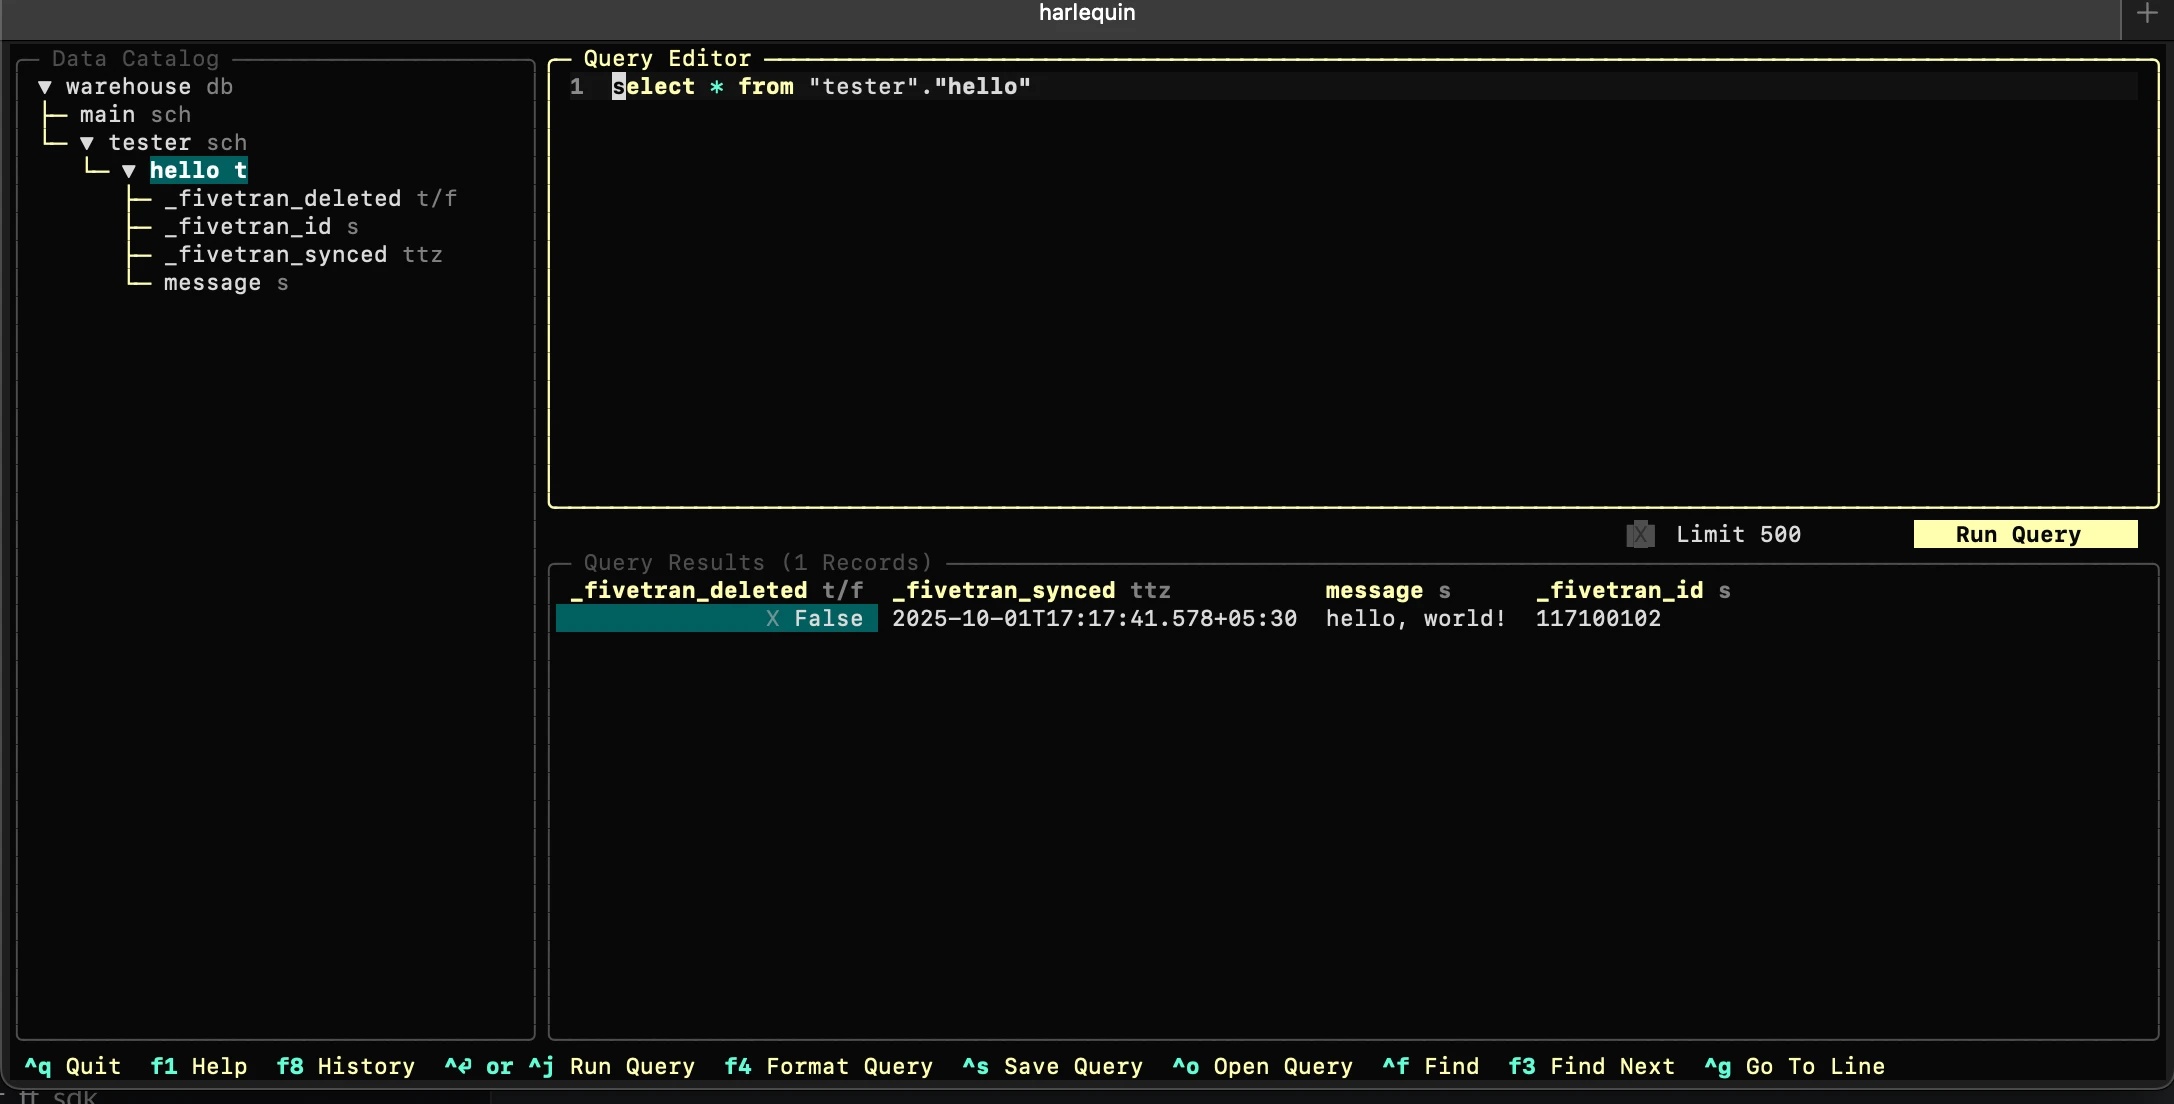
To stop Harlequin, run the following command:
Ctrl + q
If tables are not created in warehouse.db after a debug run, your connector schema may include DuckDB reserved keywords such as order, group, or desc. See Local Debug Runs Do Not Create Tables or Persist state.json for steps to resolve this.
Iterate and debug
Local testing is an iterative process:
- Run
fivetran debug. - Inspect output in
warehouse.db. - Update your connector code.
- Optionally, reset the local debug environment with
fivetran reset. - Re-run and validate changes.
Reset the local debug environment when needed
The Local Tester supports basic data operations. Schema-altering changes, such as modifying table definitions, are not fully supported in incremental debug runs. If you encounter failures after making schema changes, reset the local debug environment by running the following command from the root project folder:
fivetran reset
This command:
- Deletes the existing
warehouse.db - Deletes the local
state.jsonfile - Clears the local debug environment
After reset, run fivetran debug again to perform a clean test of your updated connector code. If the error persists, it is likely caused by an issue in your connector code.
Testing tips
- Use
fivetran debugwith real source data to test and troubleshoot your connector's behavior. - Run
fivetran debugon multiple small samples of your data to fully test your connector's logic. The Local Tester is slower than production because it runs entirely on your local machine. - Deploy to Fivetran and run end-to-end tests before moving to larger or production-sized syncs.
- State management and configuration can be used to control exactly what is tested with each run.
- Use
fivetran resetto reset the locally saved cursor andwarehouse.dbfiles, allowing you to re-runfivetran debugfrom scratch. It simulates a historical sync.
Next steps
Once you have deployed your connector to Fivetran, potential next steps include:
- Profile performance and identify bottlenecks
- Optimize memory usage