Release Notes
July 2026
We now support Dynatrace as an external logging service. You can connect Dynatrace at both the account and destination levels to collect and query your Fivetran logs. We are gradually rolling out this feature to all accounts.
To set up the Dynatrace logging service, go to Account Settings > General> External Logging, or go to your destination settings in your Fivetran dashboard. For more information, see our Dynatrace Setup Guide.
June 2026
We've improved external log service management with setup status visibility and on-demand setup testing.
Setup status in the dashboard
The log connectors dashboard now displays a status badge for each configured log service:
- Connected — the log service is reachable and working correctly.
- Broken — the log service configuration has errors that prevent log delivery. Log events are not forwarded while the log service is in this state.
- Incomplete — the log service is configured but setup has not been completed. Log events are not forwarded while the log service is in this state.
Log services that were configured before this change have no status yet and are treated as Connected by default. No setup test run is required for existing log services.
Setup testing via the API
You can now trigger setup tests when creating or updating a log service by passing "run_setup_tests": true in the request body. The test results are returned immediately in the setup_tests field of the response.
A dedicated endpoint is also available to run setup tests on demand without modifying the log service configuration:
- Group-level:
POST /v1/external-logging/{logId}/test - Account-level:
POST /v1/external-logging/account/test
Setup state in the API response
Log service endpoints return a status object when one exists. The status.setup_state field reflects the current state — connected, broken, or incomplete — and status.tasks lists any configuration issues that need attention. Log services created before this feature was introduced will not include a status field until their status is first set.
April 2026
We've added the following new audit trail log events:
Account-level events (Enterprise plan or higher):
edit_account— Account data change: Logged when an account's display name is changed. Only changed fields are included inoldValuesandnewValues.edit_account— User keys enabled or disabled: Logged when user API keys are enabled or disabled for an account.edit_account— CMK enabled, disabled, or deleted: Logged when a customer-managed key (CMK) is enabled, disabled, or deleted. Key content and credentials are not logged.
Destination-level events (Enterprise plan or higher):
delete_destination: Thedelete_destinationevent now includesoldValueswith the destination's name and service type. Theservicefield is present only when deleting viaDELETE /v1/destinations/{destinationId}.
Connection-level events (Enterprise plan or higher):
delete_private_link: Logged when a private link is deleted via the dashboard or API. Includes the private link name inoldValues.delete_proxy_agent: Logged when a proxy agent is deleted via the dashboard or API. Includes the agent name inoldValues.delete_connection: When a destination is deleted, Fivetran emits onedelete_connectionlog event per connection as part of the cascade-deleted operation. These events haveinteractionMethod: "SYSTEM".
We now always include the isRoutine field in the sync_end log event when status is RESCHEDULED, including when the value is false. This field indicates whether a reschedule is an expected routine reschedule, true, rather than an error-driven one, false. For more information, see our Logs documentation.
March 2026
We now support Grafana Loki as an external logging service. You can connect Grafana Loki at both the account and destination levels to collect and query your Fivetran logs. We are gradually rolling out this feature to all accounts.
To set up Grafana Loki logging services, go to Account Settings > General > External Logging or go to your destination settings in your Fivetran dashboard. For more information, see our Grafana Loki Setup guide.
The extract_summary log event now includes two new execution time fields for database connectors:
total_execution_time— the total accumulated query execution time in milliseconds across all tables during the sync.execution_time— the accumulated query execution time in milliseconds for each individual entry in theobjectsarray.
These fields give you visibility into which tables have the highest query execution cost, helping you identify performance bottlenecks at the table level.
The execution_time and total_execution_time fields are only available for database connectors. The objects field itself is not available for all connectors. If you need a specific connector to support this field, submit a feature request.
February 2026
We've deprecated the sql_query log event. Use the extract_summary log event instead.
We now support connecting an external logging service at the account level, in addition to the destination level. Account-level logging collects logs for all destinations in your account, and you can still connect one external log service per destination. This feature will be rolled out gradually to all customers over three next weeks.
To connect an account-level external logging service, go to Account Settings > General > External Logging in your Fivetran dashboard.
October 2025
We now reference users by unique ID instead of email address to improve data security. We updated the relevant BigQuery and Snowflake sample queries that join the LOG and USER tables.
The extract_summary log event for database connectors now includes SQL query count information, in addition to the API call count for API-based connectors. We are gradually rolling out this change to all existing connections.
See our extract_summary event documentation for more details.
May 2025
We've added the following new Audit Trail log events, which are generated for important user actions and the resulting changes:
edit_accountgenerate_api_secretcreate_teamdelete_teamedit_teamcreate_userdelete_useredit_usercreate_destinationedit_destinationcreate_connectiondelete_connectionedit_connectionsync_connection
The log events are available to accounts on the Enterprise and Business Critical plans. These new log events allow you to track actions and changes in your Fivetran account, providing a comprehensive history of user interactions and data modifications.
March 2025
We have added new fields connection_id and connection_name to all log events. They will replace current fields connector_id and connector_name, which are now deprecated and will be removed in the future.
We also added a new fields in some specific events data instead of deprecated ones:
| Event name | New field | Deprecated field |
|---|---|---|
change_schema_config | connectionId | connectorId |
change_schema_config_via_api | connectionId | connectorId |
change_schema_config_via_sync | connectionId | connectorId |
diagnostic_access_approved | connectionName | connectorName |
diagnostic_access_denied | connectionName | connectorName |
diagnostic_access_revoked | connectionName | connectorName |
diagnostic_access_ended | connectionName | connectorName |
diagnostic_access_expired | connectionName | connectorName |
diagnostic_access_granted | connectionName | connectorName |
For more information, see our Logs documentation.
We have deprecated the following Transformation log events:
dbt_run_start- replaced withtransformation_startdbt_run_succeeded- replaced withtransformation_succeededdbt_run_failed- replaced withtransformation_failed
February 2025
Fivetran Transformations are now generally available. You can leverage a stable, reliable, and production-ready environment to manage your transformation workflows.
See our How Does the New Transformation Flow Built Around dbt Jobs Differ From the Former Flow Built Around Output Models? troubleshooting page to learn more about the new features and and improvements.
December 2024
We have updated the format of logs and webhooks for user-defined dbt jobs and Quickstart transformations.
November 2024
We have removed the api_call from the log event list. Use the new event, extract_summary, instead. For more information, see our Logs documentation.
August 2024
We have added a new log event, extract_summary. For more information, see our Logs documentation.
April 2024
We no longer generate the following log events:
STATUS(deprecated)DISCONNECT_BI_TOOLCONNECT_BI_TOOLUPDATE_BI_TOOLCREATE_STAGING_TABLEAPPLY_TIER_LIMITATIONMIGRATE_SCHEMA_CONFIGSCHEMA_MIGRATION_FAILURESCHEMA_MIGRATION_SUCCESSDISMISS_WARNINGTRANSFORMATION_RUN_STARTTRANSFORMATION_RUN_SUCCEEDEDTRANSFORMATION_RUN_FAILED
For more information, see our Logs documentation.
March 2024
We have added a new log event, schema_migration_end. For more information, see our Logs documentation.
January 2024
We have removed the forced_pause_connector dashboard activity log event. We now send an automated pause event, pause_connector with the actor:Fivetran attribute. We issue the automated pause event either for broken or trial expired connectors.
December 2023
We have removed the following dashboard activity log events:
create_file_upload_tablemerge_rowsremove_file_upload_tablesignin_warehousesignout_warehouseupload_file
December 2022
We now generate the CANCELED sync status for the sync_end log event in our logs.
January 2022
We have added the sync_id field as a common field of the log events.
December 2021
We now generate the sync_end log event in our logs for every possible sync status:
SUCCESSFULFAILUREFAILURE_WITH_TASKRESCHEDULED
Previously, we generated the sync_end log event only for successful syncs.
September 2021
We now generate the change_schema_config_via_api log event in our logs when you change a schema sync configuration using our REST API. See our Logs documentation for details.
August 2021
We have updated the value of the log event's connector_id property. Previously, the connector_id and connector_name properties both contained the connector name. Now, connector_id contains the connector ID, while connector_name still contains the connector name.
Learn more in our Logs documentation.
December 2020
Fivetran now supports flushing dbt transformations event data to supported log services.
Each log service has a unique path for this data:
| Log Service | Path Pattern |
|---|---|
| AWS CloudWatch | {ACCOUNT_NAME}/{GROUP_NAME}/dbt/{DBT_JOB_NAME} |
| Azure Monitor | {ACCOUNT_NAME}_{GROUP_NAME}_dbt_{DBT_JOB_NAME}_CL |
| Google Cloud Logging | {ACCOUNT_NAME}-{GROUP_NAME}-dbt-{DBT_JOB_NAME} |
| Splunk Logging | channel.account="{ACCOUNT_NAME}"channel.group="{GROUP_NAME}"channel.service="dbt"channel.schema="{DBT_JOB_NAME}" |
Learn more in our Logs documentation.
November 2020
We have added a new log event, diagnostic_access_granted. Read our Logs documentation for more information.
September 2020
We have added a new log event, change_schema_config_via_sync. See our Logs documentation for more information.
We have deprecated the two audit tables, _fivetran_audit and _fivetran_audit_warning. We will stop populating the tables on November 6, 2023.
You can use our Fivetran Platform Connector along with our Fivetran Platform Connector data model to recreate the _fivetran_audit table in your destination. The pre-built data model uses the data stored in the log tables to create fivetran_platform__audit_table matching the _fivetran_audit table.
October 2018
Fivetran now supports flushing dashboard activity event data to supported log services.
Each log service has a unique path for this data:
| Log Service | Path Pattern |
|---|---|
| AWS CloudWatch | {ACCOUNT_NAME}/{GROUP_NAME}/dashboard/all |
| Azure Monitor | {ACCOUNT_NAME}_{GROUP_NAME}_dashboard_all_CL |
| Google Cloud Logging | {ACCOUNT_NAME}-{GROUP_NAME}-dashboard-all |
June 2018
We no longer support read_start and read_end log event values.
We can now load all of your log event data into a single column (packing).
We have added logs for the following applications:
- Adwords
- Amazon DynamoDB
- DoubleClick Campaign Manager
- DoubleClick for Publishers
- Facebook Ad Insights
- Front
- GitHub
- Google Ad Manager
- Google Ads
- Google Campaign Manager 360
- Google Sheets
- HubSpot
- Jira
- LinkedIn Ad Analytics
- Mandrill
- Marketo
- Optimizely
- QuickBooks
- Recharge
- Sailthru
- Segment
- Stripe
- Xero
- Zendesk Support
- Zendesk Chat
May 2018
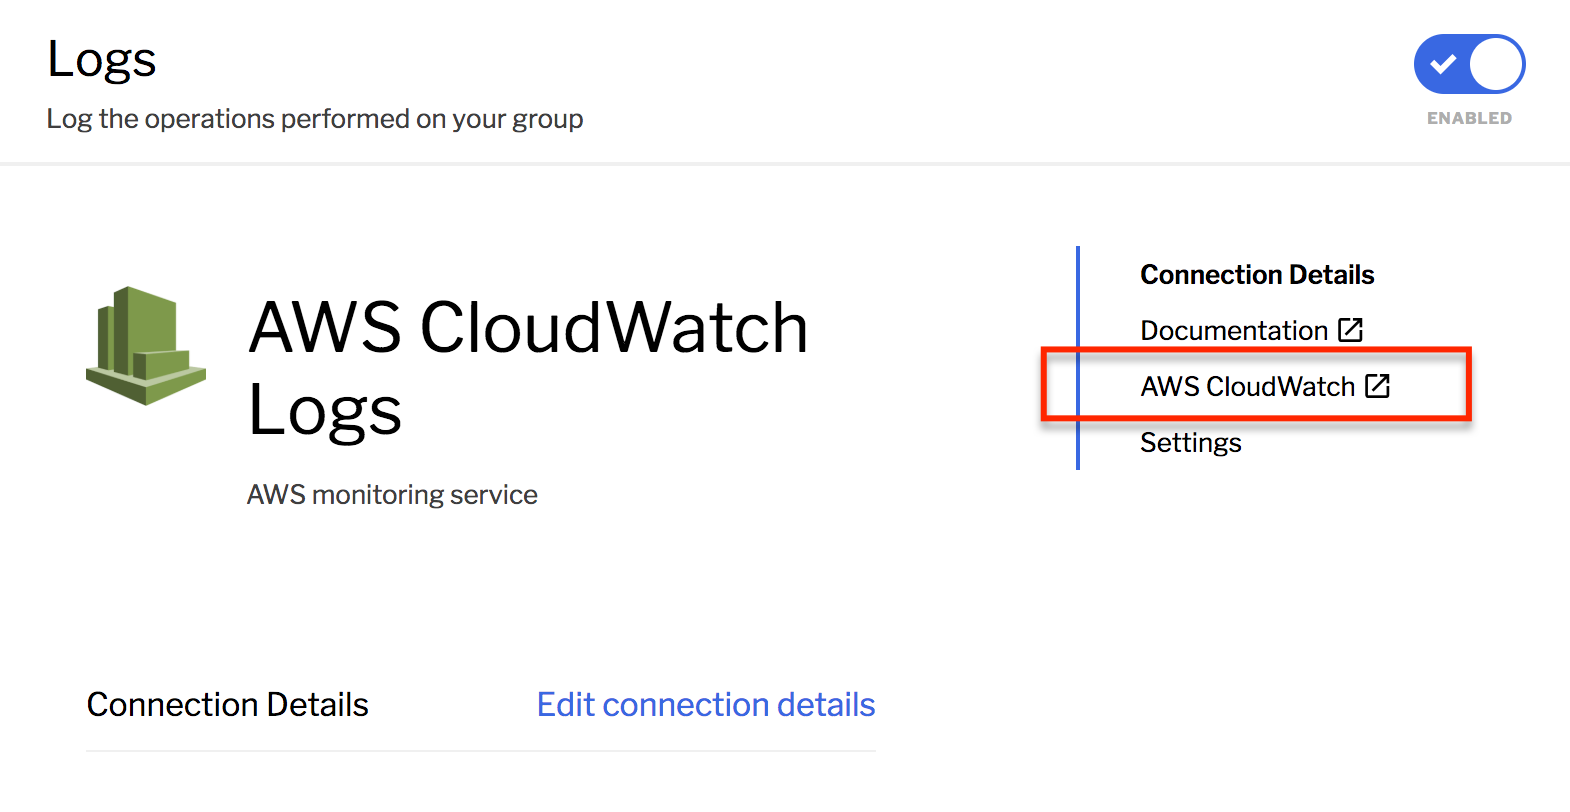
You can now navigate directly to your log service from the Connection Details page of your Fivetran dashboard.
We have added logs for the following applications:
- AdRoll
- Amazon S3
- Apple Search Ads
- Amazon CloudFront
- Dropbox
- Eloqua
- Freshdesk
- FTP
- Google Cloud Storage
- HelpScout
- Intercom
- Klaviyo
- Mailchimp
- Marin Software
- Azure Blob Storage
- Microsoft Advertising
- Mixpanel
- MySQL
- Pardot
- Recurly
- SendGrid
- SFTP
- Verizon Media
- Zuora
April 2018
We have renamed the MessageEvent event to InfoEvent.
We have added two new log events:
json_value_too_longskip_column
For more information, see our Logs documentation.
We have added support for logs for the following connectors:
- Braintree
- Apple App Store (formerly iTunes Connect)
- Kantata