Connector Performance Analysis
Performance profiling helps you identify bottlenecks and optimize your connector's performance by analyzing CPU usage and code execution time. We provide performance profiling with flamegraphs for many connector SDK syncs.
Flamegraph overview
Flamegraphs are visual representations of your connector's CPU usage and execution time. Understanding how to read them is essential for identifying performance bottlenecks and optimizing your connector. For more details, see the official CPU flamegraph documentation.
A flamegraph is a visualization where:
- X-axis (width) represents the percentage of total CPU time consumed by a function
- Y-axis (height) represents the call stack depth (functions calling other functions)
- Colors are typically assigned randomly and have no specific meaning (though some tools use color to indicate different modules or languages)
Additional resources:
- py-spy documentation
- Brendan Gregg's flamegraph guide - Original flamegraph implementation
How to interpret a flamegraph?
Most flamegraph viewers support:
- Click to zoom: Click a box to zoom into that subtree
- Search: Search for specific function names
- Hover: View exact percentages and function details
- Reset: Return to the full view
See sections below to learn how to read the stack, and understand width and call relationships.
Reading the stack
- Top layers: Entry points and top-level functions
- Lower layers: Functions called by the layers above
- Each box represents a function call
- The wider the box, the more CPU time that function consumed
Understanding width
- Wide boxes indicate functions that consume significant CPU time
- These are your primary optimization targets
- Width represents the proportion of time spent in that function and all functions it calls
Understanding call relationships
- Functions are stacked vertically to show the call hierarchy
- A function directly below another was called by the function above it
- Multiple boxes at the same level indicate different code paths
Production vs local performance profiling
Production performance profiling
Performance profiling is automatically enabled for all production syncs (where supported). After your connector runs, you can view the profiling results in your dashboard:
- Go to your connection in the Fivetran dashboard.
- Select the Monitoring tab.
- Select the sync you would like to view performance profiling for.
- Go to the Performance Profiling section.
- View the flamegraph generated by the py-spy profiler.

Production flamegraphs show clean connector execution without any testing framework overhead. The entire flamegraph represents actual production behavior, with run_update and your connector logic dominating the profile. SDK framework functions appear as thin supporting layers. This is the most accurate representation of production sync performance and should be used to validate optimizations and understand how your connector performs.
Local performance profiling
For local development and debugging, you can profile your connector using a number of tools, we recommend py-spy.
To install py-spy locally, run pip install py-spy in the environment where you use fivetran debug. Once you have installed py-spy, generate a cpu_profile.svg file containing a flamegraph of your connector's execution:
py-spy record -o cpu_profile.svg -- fivetran debug --configuration configuration.json
The py-spy profiler does not currently support Python 3.14. If you require profiling, use a Python version lower than 3.14.
This will give us a profiling output for Fivetran debug command. We can clear the previous state using fivetran reset, which will give the profiler output for the entire debug run.
This generates a cpu_profile.svg file containing a flamegraph of your connector's execution.

Local flamegraphs include significant tester overhead from initialization, setup, logging, and test harness code that doesn't exist in production. When analyzing local profiles, focus exclusively on the run_update method and ignore tester-related functions. The CPU time distribution is skewed by testing overhead, making your connector code appear proportionally smaller. Always validate local profiling findings with production profiles, as optimizations may show different results due to differences in data volumes, network conditions, and the absence of tester overhead.
To measure memory usage locally, you can use tracemalloc or psutil. See the Connector Memory Management doc for guidance.
How to find performance bottlenecks
Look for these indicators of potential issues:
Wide boxes

A function that spans a large portion of the X-axis is consuming significant CPU time.
Tall towers
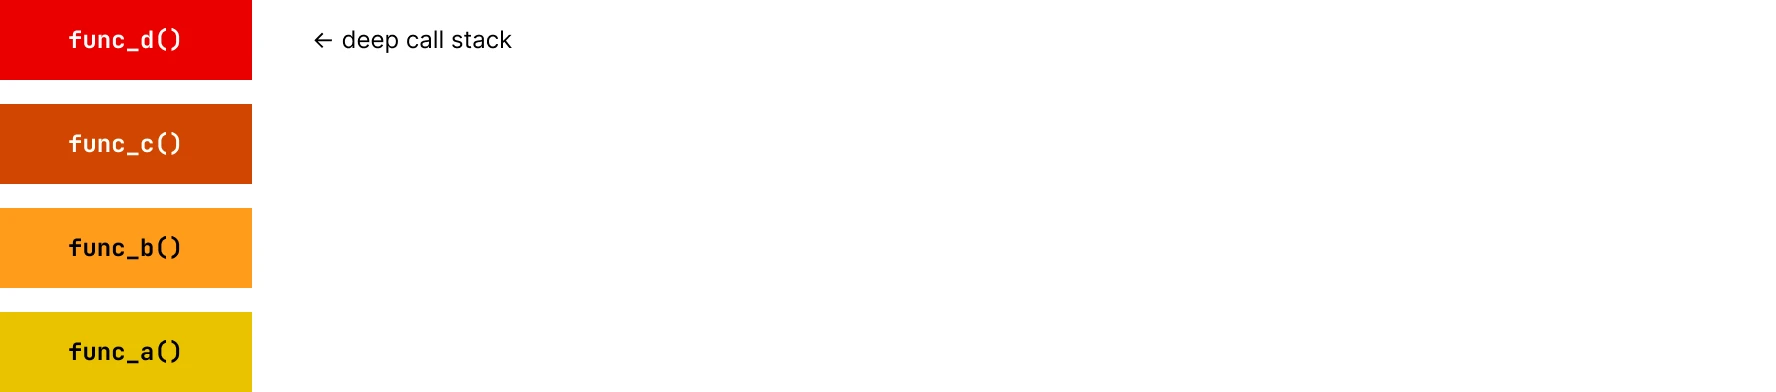
Deep call stacks may indicate:
- Excessive recursion
- Over-abstracted code
- Opportunity for inlining or simplification
Repetitive patterns

The same function appearing multiple times at the same level indicates it's called from several places. The combined width of these identical boxes shows their total CPU usage.
Connector-specific analysis
Focus on the run_update method
When profiling your Connector SDK code, prioritize analysis of the run_update method and its children. The run_update method contains your custom connector logic.
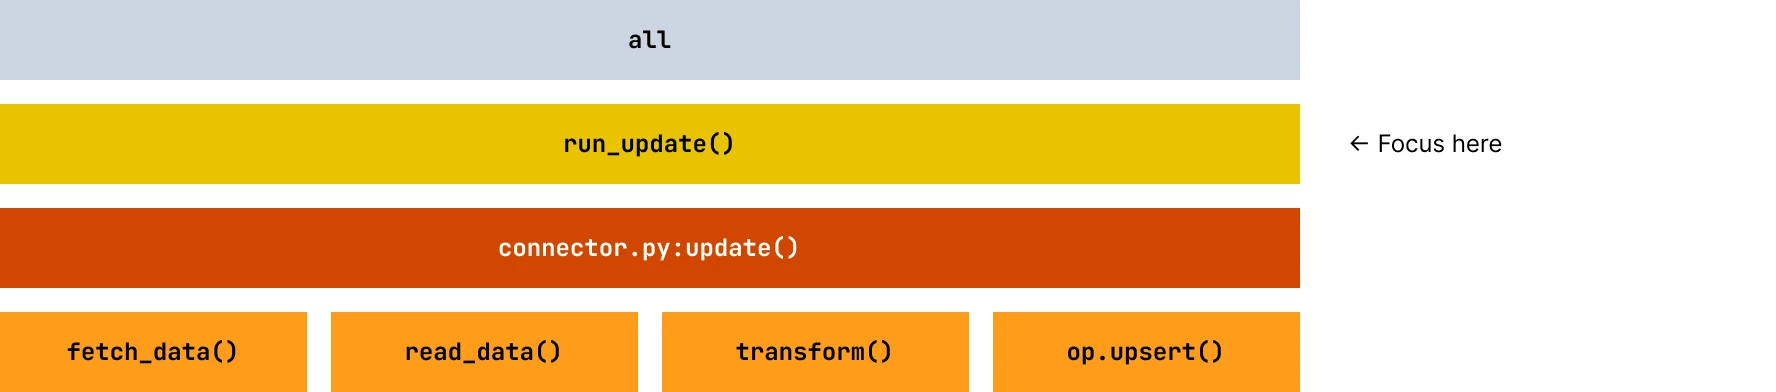
Any functions outside this method are typically SDK framework code or the local tester. Optimizing framework code won't improve your connector's production performance. You can see the filename and line number of your code to identify which part of the code you can optimize.
Common connector bottlenecks
API call patterns

- Issue: Sequential API calls are creating latency.
- Solution: Implement a single function that fetches a batch of data to reduce API call latency.
Data processing loops
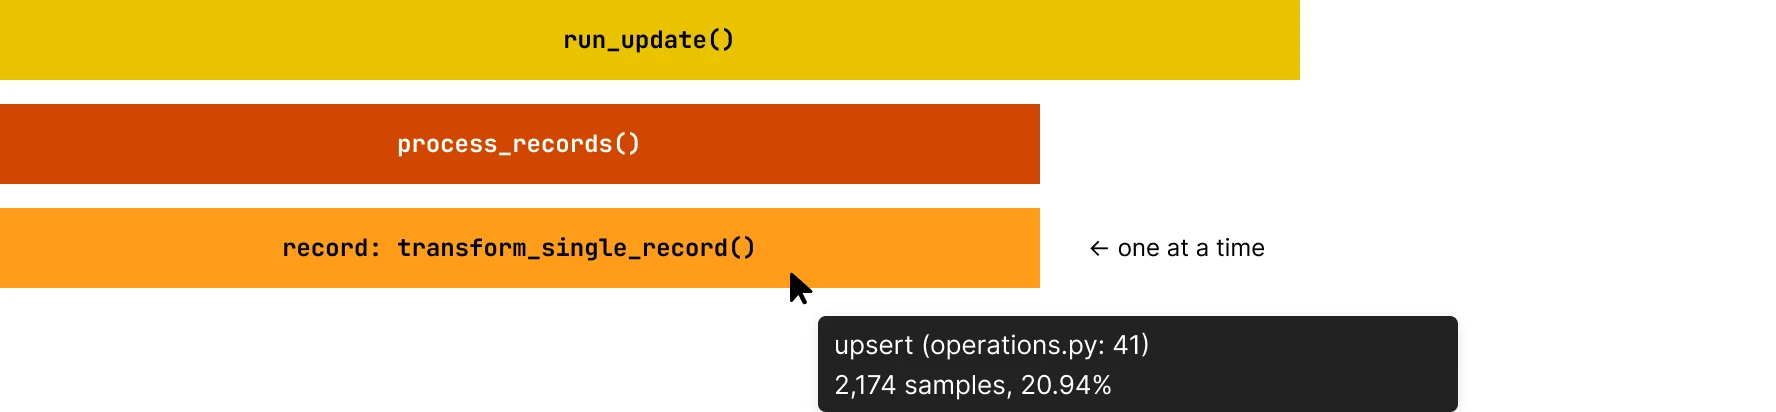
- Issue: Inefficient row-by-row processing, transform_single_record is being called in a loop. You can verify this by hovering over the function to see the number of invocations for it.
- Solution: Use batch processing or vectorized operations.
Excessive JSON parsing
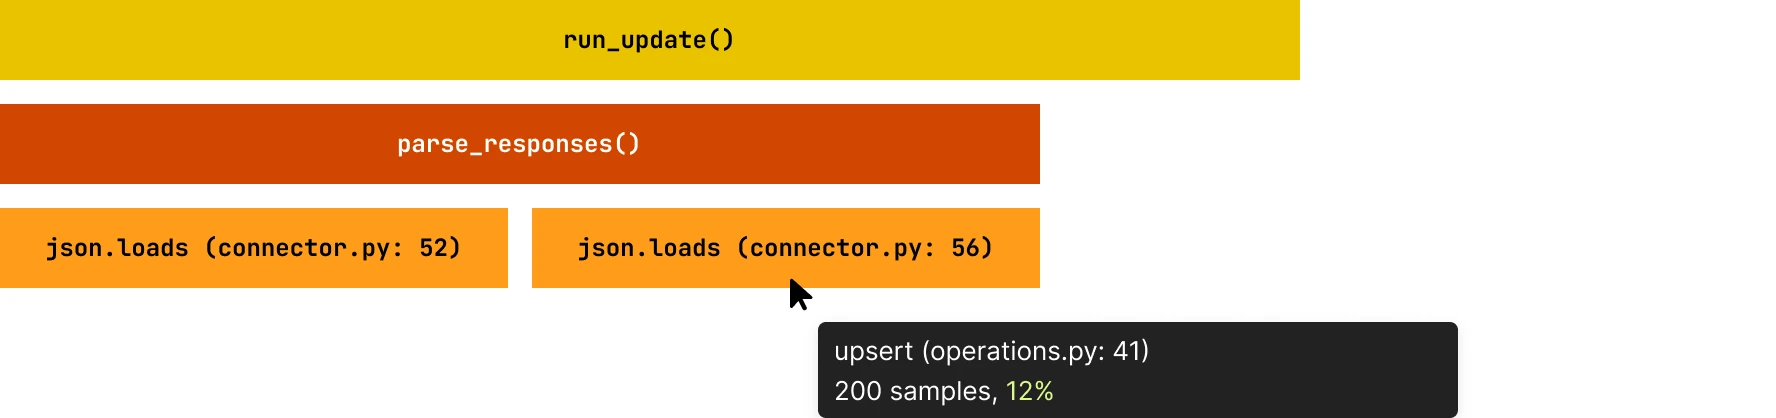
- Issue: Repeatedly parsing the same data. You can hover over the parsing function to see the percentage of total time it consumes.
- Solution: Cache parsed results or parse once. This will reduce the total CPU usage percentage for the function.
Only implement caching if the input is a small set of values, or you are sure that the memory footprint is small, to avoid out-of-memory issues in the sync.
Optimizing performance
Identify widest boxes
Start with functions consuming the most CPU time (widest boxes in the flamegraph).
Verify if it's your code
Ensure the function is within your run_update method, not SDK framework code.
Understand the context
- Why is this function called?
- How often is it called?
- Can it be called less frequently?
- Can it be made faster?
Measure improvement
After optimization, generate a new flamegraph and compare:
- The optimized function should have a narrower box
- The overall width of
run_updateshould decrease - Total execution time should improve
What to avoid?
| What not to do | Why |
|---|---|
| Don't optimize framework code. | If the bottleneck is in SDK framework code (outside run_update), contact Fivetran support rather than trying to work around it. |
| Don't ignore small boxes in hot paths. | A small box called thousands of times can be more impactful than a large box called once. |
| Don't optimize without measuring. | Always profile before and after optimizations to verify improvements. |
| Don't ignore I/O wait time. | Flamegraphs show CPU time, not wall-clock time. If your connector spends most time waiting for I/O (network, disk), the flamegraph may not show the full picture. |
| What can be verified | Details |
|---|---|
| Multi threaded profile displayed. | The CPU time shows up a cumulative of time taken in all threads. So if a function is called from multiple threads it will sum up the time in the profiler output. |
| Use Logging to identify I\O wait | Use structured timing logs around all external I/O boundaries (DB calls, HTTP requests). Log start/end timestamps and correlation IDs per request, then compute the total durations in your log pipeline to approximate the waiting time. |
Example analysis
Consider this flamegraph pattern:
run_update() [100% width]
├── fetch_all_records() [60% width]
│   └── api_call() [58% width]
│       └── requests.get() [55% width]
│           └── socket.recv() [50% width]  ← I/O wait
├── load_data() [35% width]
│   └── json.loads() [30% width]  ← High CPU usage
│       └── _decode() [25% width]
└── op.upsert() [5% width]
Analysis:
- 60% in API calls: Consider concurrent requests or pagination optimization
- 35% in JSON parsing: Consider streaming parsers or caching
- 5% in SDK operations: This is efficient, no optimization needed
Optimization priority:
- Highest priority: Implement concurrent API fetching (addresses 60% bottleneck)
- Medium priority: Optimize JSON parsing (addresses 35% bottleneck)
- Skip: SDK operations are already efficient
Getting help
If you need assistance interpreting your connector's flamegraph:
- Download the SVG file from the Monitoring tab (production) or generate it locally. To download the production flamegraph from the dashboard URL, navigate to the Performance Profile Tab for any sync and save the .svg file locally.
- Identify the specific pattern or function causing concern.
- Use any AI agent, and pass the following details:
- The flamegraph file and your connector code
- suggested prompt: You are analyzing a CPU flamegraph generated using py-spy for a Fivetran Connector SDK sync. I have provided the Fivetran connector code. Please, help me understand where my code bottlenecks are.
- Specific questions about patterns you're seeing