

The ultimate guide to data integration

[CTA_MODULE]
Chapter 1: Using analytics for better decision-making
Analytics is fundamentally about using data to solve problems, and data integration is an essential first step for analytics.
In a business context, analytics can help you improve customer acquisition, retention, and loyalty; identify new opportunities; and enhance existing products and services. With data, your organization can radically improve its decision-making and gain a keen edge over the competition.
Practically speaking, analytics comes in the following forms:
- Ad hoc reporting. Key stakeholders and decision-makers sometimes need answers to specific questions on a one-time or occasional basis.
- Business intelligence. Often used interchangeably with “analytics,” business intelligence (BI) generally refers to the use of dashboards and reports to support decisions.
- Data as a product. Data is a tradeable resource. An organization might make data available to third parties as embedded dashboards, data streams, recommendations and other data products.
- Artificial intelligence/machine learning. The pinnacle of analytics, sometimes referred to as data science, is predictive modeling that automates important decisions and processes.
All forms of analytics have become increasingly important as the volume and complexity of data grow at breakneck speed.
What is big data?
Big data refers to the massive volume and complexity of modern data and arises from the growth of internet-based, decentralized computation and storage, also known as the cloud. Cloud-based applications and devices (including the growing internet of things) produce extensive digital footprints of data that can be turned into valuable insights.
This data is typically stored in cloud-based files and operational databases, and then exposed to end users in the form of:
- API feeds
- File systems
- Database logs and query results
- Event streams
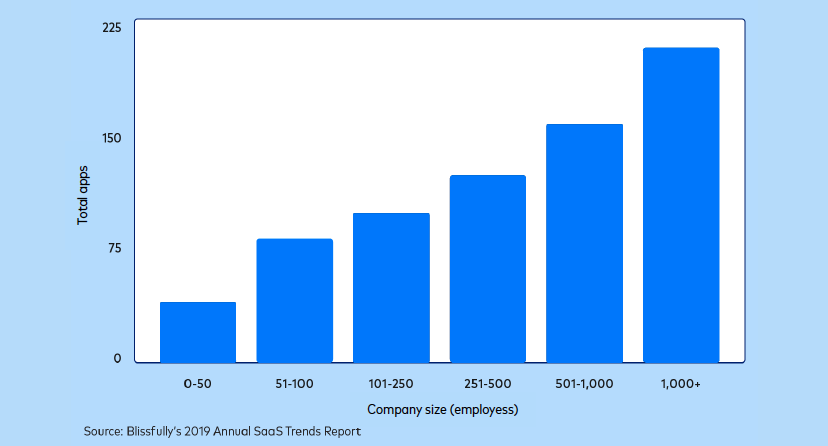
Cloud-based technologies, especially Software-as-a-Service (SaaS), have become increasingly prolific. A typical organization now uses dozens or hundreds of applications.
By the same token, the overall volume of data produced worldwide has exploded in the last decade:
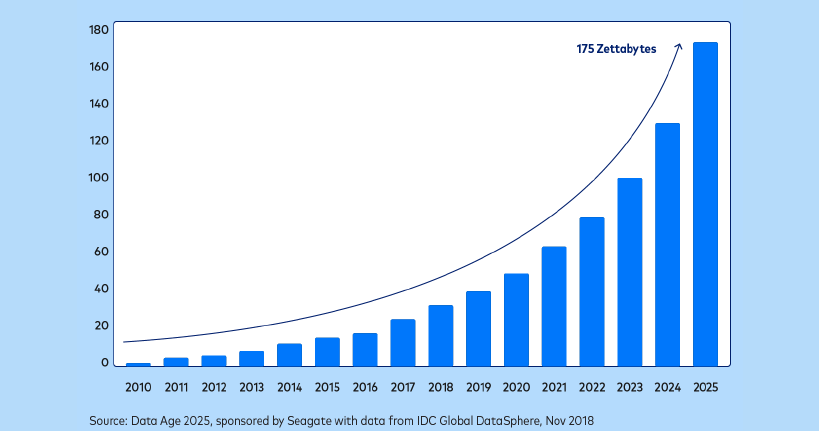
As the volume and granularity of data continue to grow, so do opportunities for analytics. More data means understanding and predicting phenomena with greater accuracy than ever before.
Chapter 2: What is data integration?
Data integration encompasses all the activities required to prepare data for analytics.
Data is produced from:
- Manual data entry, such as forms collected and processed by an office
- Sensor inputs, such as scans at a checkout line
- Digital documents, content, and media, such as social media posts
- Digital activity recorded by software triggers, such as clicks on a website or app
Before anyone can use data to recognize patterns and identify causal mechanisms, the data must be in one place and organized in a manageable fashion.
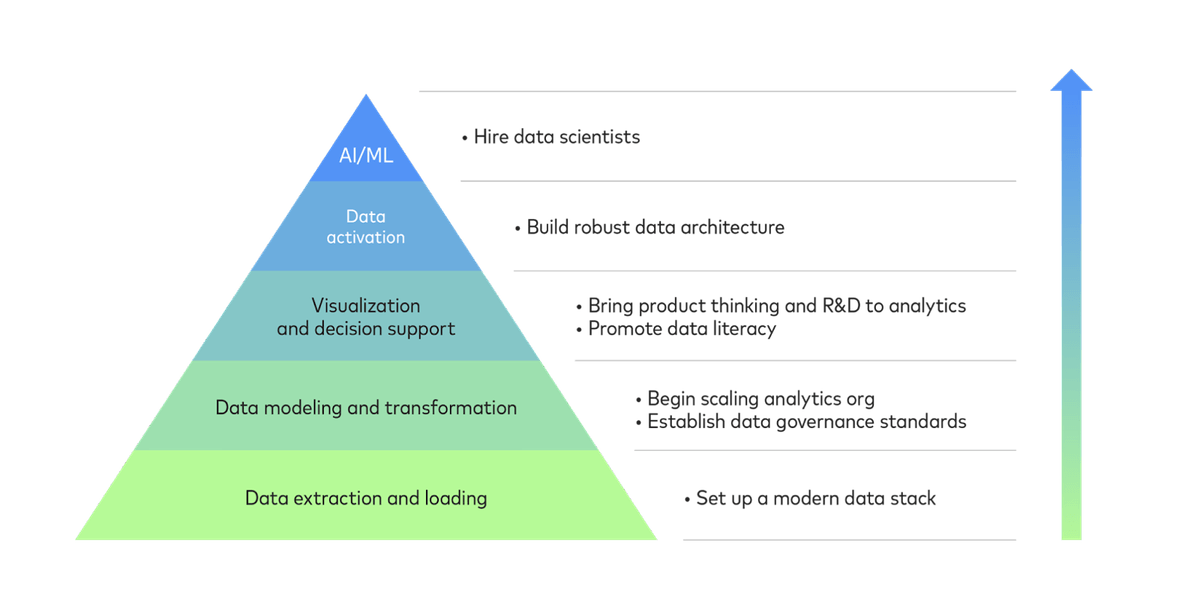
Data integration, analytics, and data science are all levels in a hierarchy of needs:
- Data extraction and loading. The first step to data integration is gathering data and make it available on a single platform. This is best accomplished with the help of a suite of tools called the modern data stack.
- Data modeling and transformation. Once data from multiple data sources is in one place, your analysts can massage it into structures that support dashboards, visualizations, reports and predictive models. As your needs grow over time, this will require scaling your data team and establishing standards for data governance.
- Visualization and decision support. Now, you are ready for analytics. Your data models will enable you to create a comprehensive view of your operations. Build reports and dashboards as needed. To best accommodate these activities, you will need to bring product management best practices into the production of data assets and promote data literacy across your organization.
- Data activation. Analytics data can be routed back into your operational systems to give your team members real-time visibility into operations or to automate business processes that depend on specific inputs of data.
- AI and machine learning. The pinnacle of data science is building systems that leverage artificial intelligence and machine learning, ranging from simple predictive models to autonomous agents. At this stage, your organization needs specialists such as data scientists and machine learning engineers.
The data integration process
In order to make raw data ready for analytics:
- Data is gathered from sensor feeds, manual data entry or software, and stored in files or databases.
- Data is extracted from files, databases and API endpoints and centralized in a destination.
- Data is cleansed and modeled to meet the analytics needs of various business units.
- Data is used to power products or business intelligence.
Data integration can be performed in a manual, ad hoc manner or programmatically using software. The ad hoc approach is slow, error-prone, unreplicable and unscalable, yet 62% of organizations use spreadsheets to manually combine and visualize data. Shockingly, many data scientists use the same method to produce one-off reports.
By contrast, the programmatic approach to data integration involves a suite of tools called a data stack, and allows an organization to partially or wholly automate data integration.
Important characteristics of data sources and destinations
Before we discuss the data stack, it’s important to point out that every application has an underlying data model that reflects how the product works.
A data model is an abstract, strictly formatted representation of reality. A schema is a practical blueprint for turning a data model into a database with tables, rows, columns, and interrelations.

The destination for the data is typically a relational database that is optimized for analytics called a data warehouse. Data warehouses store structured data that follows highly specific formatting rules for the sake of easy interpretation by machine, and is organized into tables with rows and columns.
What makes a data stack?
A data stack is a suite of tools and technologies used for programmatic data integration. The elements of a data stack include:
- Data sources. These include applications, databases, files and digital events.
- Data pipeline. Software made up of data connectors that extract data from a source and load it into a destination. Data connectors may also apply light transformations such as normalizing and cleaning data, orchestrate transformations into models for analysts, or simply load raw data.
- Destinations. Central data repositories, typically either data lakes or data warehouses, that permanently store large amounts of data. Data warehouses follow a relational structure while data lakes can accommodate mass storage of files.
- Transformation and modeling layer. It is usually necessary to transform raw data to ready it for analysis. This can involve joining tables together, performing aggregate calculations, pivoting data, or reformatting data. Transformations may be performed within the data pipeline (ETL) or within the data warehouse (ELT).
- Analytics tools. These include off-the-shelf business intelligence platforms for reporting and dashboards, as well as analytics and data science packages for common programming languages. Analytics tools are used to produce visualizations, summaries, reports, and dashboards.
The elements of a data stack can be hosted on-premise or in the cloud.
Chapter 3: How to plan and set up data integration
There are two main approaches to data integration and organizing data stacks. One of these approaches, ETL, is becoming obsolete, while ELT leverages continuing advancements in technology.
What is ETL?
The traditional approach to data integration, Extract, Transform, Load (ETL), dates from the 1970s and is so ubiquitous that “ETL” is often used interchangeably with data integration. Under ETL, data pipelines extract data from sources, transform data into data models for analysts to turn into reports and dashboards, and then load data into a data warehouse.
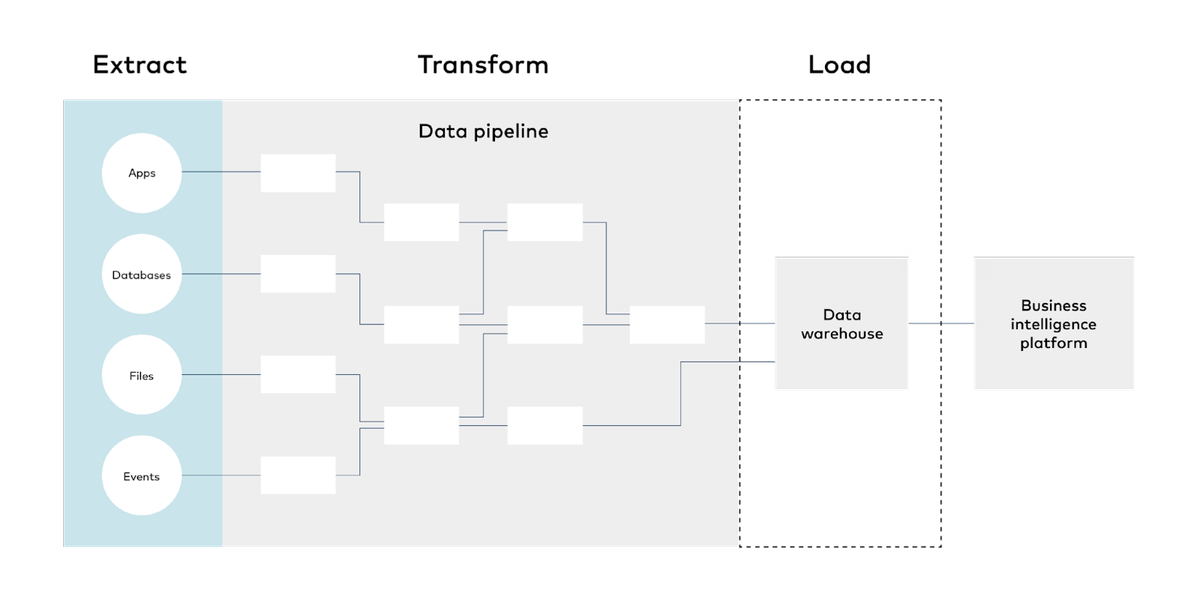
Data transformations typically aggregate or summarize data, shrinking its overall volume. By transforming data before loading it, ETL limits the volume of data that is warehoused, preserving storage, computation, and bandwidth resources. When ETL was invented in the 1970s, organizations operated under extreme scarcity of storage, computation, and bandwidth.
The project workflow for ETL consists of the following steps:
- Identify desired data sources.
- Scope the exact analytics needs the project solves.
- Define the data model/schema that the analysts and other end-users need.
- Build the pipeline, consisting of extraction, transformation and loading functions. This requires a significant outlay of engineering time.
- Analyze the data to extract insights.

Under ETL, extraction and transformation are tightly coupled because both are performed before any data is loaded to a destination. Moreover, because transformations are dictated by an organization’s specific analytics needs, every ETL pipeline is a complicated, custom-built solution. The bespoke nature of ETL pipelines makes it especially challenging to add or revise data sources and data models.
Specifically, the ETL workflow must be repeated under two very common conditions for any data-literate organization:
- Upstream schemas change. Specifically, fields are added, deleted, or changed at the source. An application might, for instance, begin collecting new customer data. These changes break the code used to transform the raw data into analysis-ready data models.
- Downstream analytics needs change, requiring new data models. An analyst might, for instance, want to create a new attribution model that requires several data sources to be joined together in a new way.
Since extraction and transformation precede loading, this means that transformation stoppages prevent data from being loaded to the destination, causing data pipeline downtime.
Using ETL for data integration therefore involves the following challenges:
- Perpetual maintenance and revision – Since the data pipeline both extracts and transforms data, the moment upstream schemas or downstream data models change, the pipeline breaks and the code base must be revised.
- Customization and complexity – Data pipelines perform sophisticated transformations tailored to the specific analytics needs of the end users. This means custom code.
- Lost engineering resources – The system requires dedicated engineers to build and maintain because it runs on a bespoke code base.
These challenges reflect the key tradeoff made under ETL, conserving computation and storage resources at the expense of labor.
Technology trends toward cloud data integration
ETL made sense at a time when computation, storage, and bandwidth were extremely scarce and expensive. These technological constraints have since disappeared.
The cost of storage has plummeted from nearly $1 million to a matter of cents per gigabyte over the course of four decades:

The cost of computation has shrunken by a factor of millions since the 1970s:

And the cost of internet transit has fallen by a factor of thousands:

These trends have made ETL and its trade-offs obsolete in two ways. First, the affordability of computation, storage, and internet bandwidth has led to the explosive growth of the cloud and cloud-based services. As the cloud has grown, the volume, variety, and complexity of data have grown as well. A brittle pipeline that integrates a limited volume and granularity of data is no longer adequate.
Secondly, the affordability of computation, storage, and internet bandwidth allows modern data integration technologies to be based in the cloud and store large volumes of untransformed data in data warehouses. This makes it practical to reorder the data integration workflow.
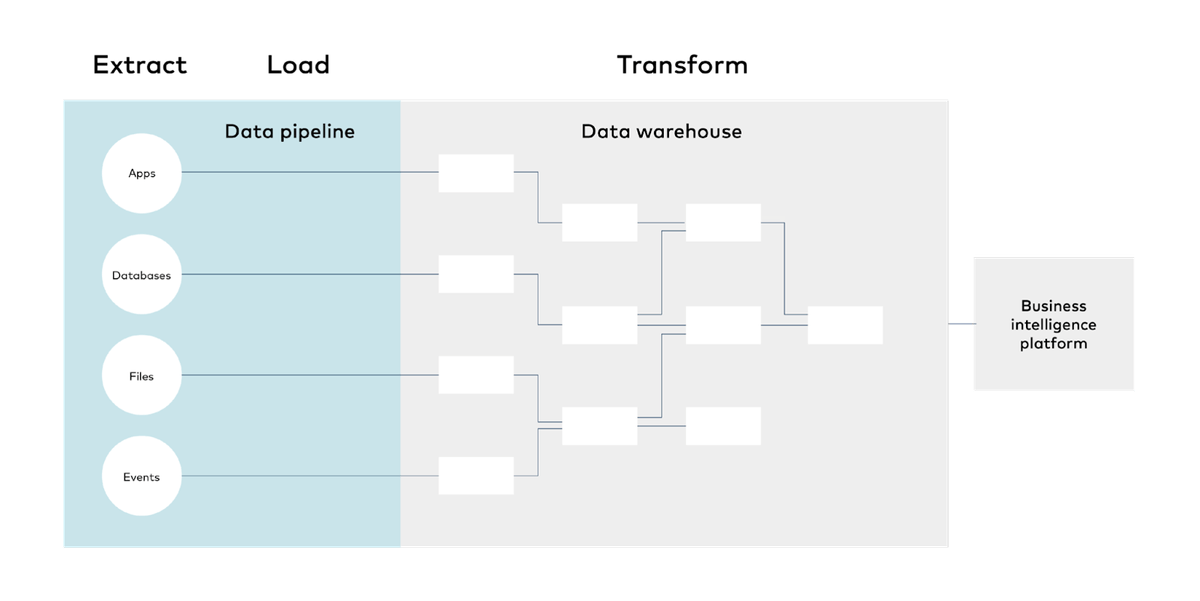
What is ELT? A modern alternative to ETL
The ability to store untransformed data in data warehouses enables a new data integration architecture, Extract, Load, Transform (ELT), in which transformation takes place at the end of the workflow and data is more-or-less immediately loaded to a destination upon extraction.

This prevents the two failure states of ETL (i.e. changing upstream schemas and downstream data models) from interfering with extraction and loading, leading to a simpler and more robust approach to data integration.
The ELT workflow features a shorter project cycle than ETL:
- Identify desired data sources
- Perform automated extraction and loading
- Scope the exact analytics needs the project is meant to solve
- Create data models by building transformations
- Perform analytics and extract insights

Under ELT, extracting and loading data are upstream of transformation and therefore independent of it. Although the transformation layer may still fail as upstream schemas or downstream data models change, these failures do not prevent data from being loaded into a destination. An organization can continue to extract and load data even as transformations are periodically rewritten by analysts. Since the data is warehoused with minimal alteration, it serves as a comprehensive, up-to-date source of truth.
Moreover, since transformations are performed within the data warehouse environment, there is no longer any need to design transformations through drag-and-drop transformation interfaces, write transformations as Python scripts, or build complex orchestrations between disparate data sources. Instead, transformations can be written in SQL, the native language of most analysts. This turns data integration from an IT- or engineer-centric activity to one directly owned by analysts.
Finally, and most crucially, the ELT architecture makes extraction and loading practical to outsource, automate, and standardize. Since transformations are performed within the warehouse, the “EL” part of the pipeline does not need to produce a differentiated output based on an organization’s specific needs.
Instead, an external provider can provide a standardized schema to every customer. Since there are few ways to normalize a schema, the most sensible way to standardize a data model is through normalization. Normalization fosters data integrity, ensuring that data is accurate, complete, consistent, and of known provenance, and also makes data models easier for analysts to interpret. Standardized outputs have the added benefit of enabling derivative products such as templated analytics products.
Major differences between ETL and ELT
The following table summarizes the differences between ETL and ELT:
| ETL | ELT |
|---|---|
| Extract, transform, load | Extract, load, transform |
| Integrate summarized or subsetted data | Integrate all raw data |
| Loading and transformation tightly coupled | Loading and transformation decoupled |
| Longer time to load data | Shorter time to load data |
| Transformation failures stop pipeline | Transformation failures do not stop pipeline |
| Predict use cases and design data models beforehand or else fully revise data pipeline | Create new use cases and design data models any time |
| Bespoke | Off-the-shelf |
| Constant building and maintenance | Automated |
| Conserves computation and storage | Conserves labor |
| Use scripting languages for transformations | Use SQL for transformations |
| Engineering/IT-centric; expert system | Analyst-centric; accessible to non-technical users |
| Cloud-based or on-premise | Almost strictly cloud-based |
There are some cases where ETL may still be preferable over ELT. These specifically include cases where:
- The desired data models are well-understood and unlikely to change quickly. This is especially the case when an organization also builds and maintains the systems it uses as data sources.
- There are stringent security and regulatory compliance requirements concerning the data, and it cannot be stored in any location that might be compromised.
These conditions tend to be characteristic of very large enterprises and organizations that specialize in Software-as-a-Service products. In such cases, it may make sense to use ELT to integrate data from third-party SaaS products while using ETL to integrate in-house, proprietary data sources.
Realize the benefits of ELT and automation
An organization that combines automation with ELT stands to dramatically simplify its data integration workflow. A simplified data integration workflow acts as a force multiplier to data engineering, enabling data engineers to focus on more mission-critical projects such as optimizing an organization’s data infrastructure or productionizing predictive models rather than constructing and maintaining data pipelines. Analysts and data scientists can finally use their understanding of business to model and analyze data instead of wrangling or munging it.
Chapter 4: Build vs. buy for data integration
What are the tradeoffs between building and buying your own data integration solution? In most cases, it makes more sense to buy an off-the-shelf solution.
The cost of building a data pipeline
In order to estimate the cost of building pipeline, you need estimates for the following figures:
- Average yearly salary for your data engineers or whoever performs data integration, most likely analysts or data scientists
- Number of data sources of various types, such as:
- Applications - SaaS products such as Salesforce, Marketo, Zendesk, NetSuite, etc.
- Databases - Operational and transactional systems such as MySQL, PostgreSQL, SQL Server, etc.
- Event tracking - Software that monitors behavior on apps and websites like include Segment, Snowplow, and Webhooks
With these figures, you can estimate the time and money spent on engineering. The following calculations are on the optimistic end.
First, apply a multiplier of 1.4 (includes benefits and overhead) to the salary in order to arrive at the cost of labor.
- If you lowball the cost of a data engineer at $120,000, then the total cost of labor is $120,000 * 1.4 = $168,000
Assume that it takes about 7 weeks to build a connector and about 2 weeks per year to update and maintain it. Each connector takes about 9 weeks of work per year.
- With five connectors, that’s 5 * (7 + 2) = 45 weeks of work per year
Use the weeks of work per year to calculate the fraction of a working year this accounts for. Then, multiply it by the cost of labor to arrive at the total monetary cost. Assume the work year lasts 48 weeks once you account for vacations, paid leave, and other downtime.
- If the cost of labor is $168,000, five connectors take 45 weeks of work, and there are 48 working weeks in a year, then ($168,000) * (45 / 48) = $157,500.
Based on our experiences at Fivetran, these figures should give you a realistic starting point to understand how costly a DIY data integration solution can be.
Probable costs of an automated solution
The cost of subscription for an automated solution may be a flat yearly rate or based on consumption. There are many different kinds of pricing available, such as monthly active rows (MAR).
Labor costs for an automated solution should be very low. The effort involved in bringing data into the warehouse should be measured in minutes or hours per year rather than weeks.
Chapter 5: How to build a modern data stack
We previously covered that a data stack is the suite of tools and processes used to extract, load, transform, and analyze data. The modern data stack leverages advancements in cloud-based technologies, third-party tools, and automation. A common setup is listed below:
- Sources – mostly cloud-based SaaS such as Salesforce, Marketo, or NetSuite and operational systems such as PostgreSQL or MySQL.
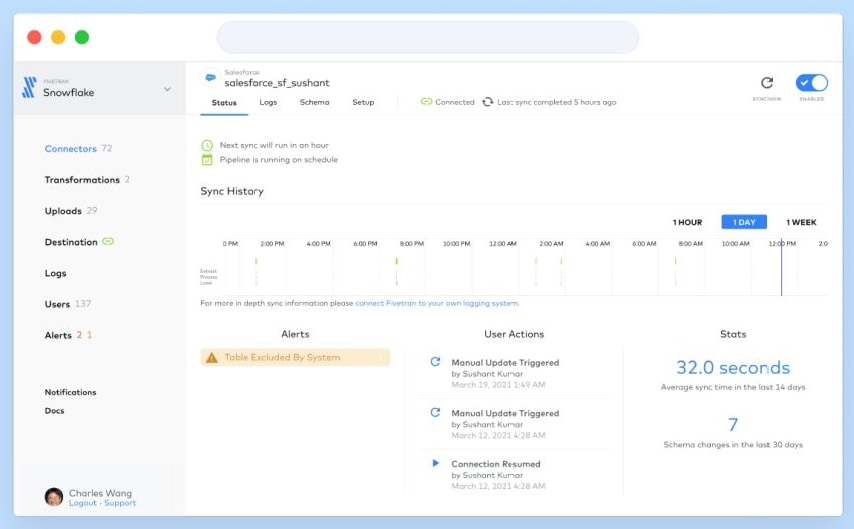
- Data pipeline – a cloud-based, automated ELT tool like Fivetran, Stitch, or Matillion
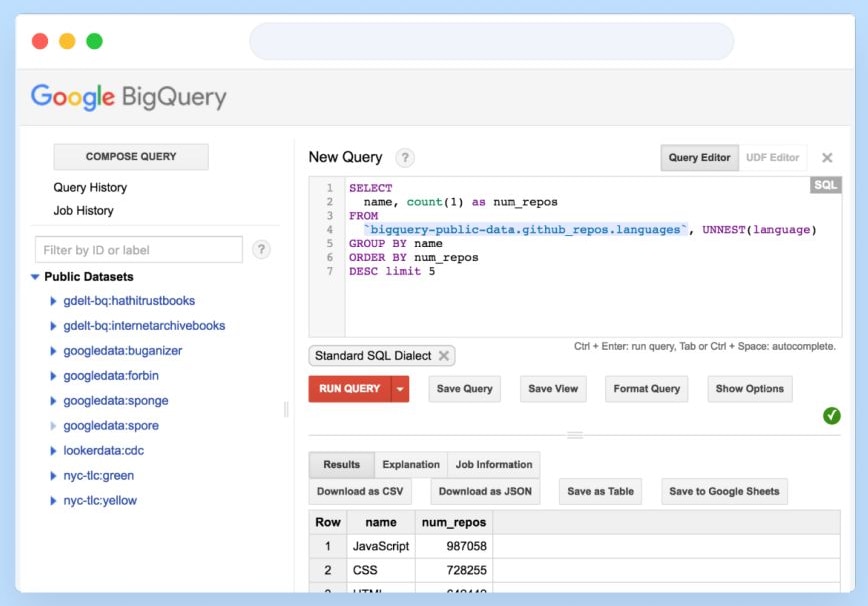
- Destination – a cloud data warehouse such as Snowflake, Redshift, BigQuery, or Azure
- Transformation tool – a SQL-based tool, like dbt, that can be attached to a cloud data warehouse
- Analytics/Business intelligence platform – a cloud-based tool or collection of tools for turning data into actionable insights in the guise of visualizations, reports, and machine learning. Business intelligence platforms include Tableau, Looker, Qlik, PowerBI, and other tools for creating dashboards and reports. More technical tools include programming languages like R or Python and its libraries such as Pandas, scikit-learn, matplotlib, Jupyter, etc.
Together, the cloud-based elements of a modern data stack make data-driven decisions radically simpler to implement than with traditional on-premise, legacy technologies.
Key business considerations
For each element of your data stack, you should consider the following factors:
- Pricing and costs
- Fit to team’s skills and future plans
- Vendor lock-in and future-proofing
These are organizational considerations that have more to do with how you plan to grow and sustain your organization in the future than the technical characteristics of each tool.
Choosing the right data integration tool
There are many data integration tools in the market, and their technical approaches and feature sets vary significantly. Here are the foremost factors to consider when choosing a data integration tool:
- Data connector quality. Take these factors into account when evaluating connector quality:
- Open-source vs. proprietary. There are open-source connectors for a wider range of data sources, but proprietary connectors tend to be of higher quality and integrate more seamlessly with other elements of a data stack.
- Standardized schemas and normalization. Data from API feeds is not usually normalized. Normalization fosters data integrity, while standardization enables outsourcing and automation by allowing a provider to support the same solution to a wide range of customers.
- Incremental vs. full updates. Incremental updates using logs or other forms of change detection allow for more frequent updates that do not interfere with business operations.
- Support for sources and destinations. Does the tool support your sources and destinations? Does the provider offer a way for customers to suggest new sources and destinations? Do they routinely add new ones?
- Configuration vs. zero-touch. Zero-touch, fully managed tools are extremely accessible, with connectors that are standardized, stress-tested and maintenance-free. Configurable tools require you to dedicate engineering time.
- Automation. Integration tools should remove as much manual intervention and effort as possible. Consider whether a tool offers features like automated schema migration, automatic adjustment to API changes, and continuous sync scheduling.
- Transforming within vs. before the data warehouse. In general, avoid ETL. Under ELT (extract-load-transform), transformations are performed in an elastic, cloud-based warehouse, allowing limitless resource scaling.
- Recovery from failure. You don’t want to ever permanently lose data. Find out whether your prospective tools are idempotent and perform net-additive integration.
- Security and compliance. These are key areas, both in terms of data protection and public perception. Specifically, learn how prospective tools deal with:
- Regulatory compliance
- Limited data retention
- Role-based access
- Column blocking and hashing
Choosing the right data warehouse
Your data warehouse will be the repository of record for your organization’s structured data. Different data warehouses offer different features and tradeoffs. Here are the nine criteria you should focus on:
- Centralized vs. decentralized data storage. Does the data warehouse store all of its data on one machine, or is it distributed across multiple machines, trading redundancy for performance?
- Elasticity. Can the data warehouse scale compute and storage resources up and down quickly? Are compute and storage independent from each other or coupled together?
- Concurrency. How well does the data warehouse accommodate multiple simultaneous queries?
- Load and query performance. How quickly can you complete typical loads and queries?
- Data governance and metadata management. How does the data warehouse handle permissions and regulatory compliance?
- SQL dialect. Which dialect of SQL does the data warehouse use? Does it support the kinds of queries you want to make? Will your analysts have to adjust the syntax they currently use?
- Backup and recovery support. If your data warehouse somehow gets corrupted or breaks, can you easily revert to a previous state?
- Resilience and availability. What about preventing database failures in the first place.
- Security. Does the data warehouse follow current security best practices?
As a repository for your data, your choice of data warehouse may very well be the most financially impactful part of your data stack. Upgrades and changes to your data warehouse involve data migrations and are very costly.
Choosing the right business intelligence tool
Business intelligence tools enable you to easily build reports and dashboards, but different tools have different strengths and weaknesses. Here are the key factors to consider:
- Seamless integration with cloud data warehouses. Is it easy to connect this BI tool to your cloud data warehouse of choice?
- Ease of use and drag-and-drop interfaces. Ease of use is especially important to popularizing data-driven decisions across your organization.
- Automated reporting and notifications. Writing reports by hand can get tedious. Does the BI tool allow you to schedule reports to publish automatically? What about alerting users when the data changes?
- Ability to conduct ad hoc calculations and reports by ingesting and exporting data files. Your analysts and data scientists might sometimes want to explore data without the overhead of having to go through a data warehouse first.
- Speed, performance and responsiveness. Basic quality-of-life considerations are important, like dashboards and visualizations loading in a timely manner.
- Modeling layer with version control and development mode. Does the BI tool allow your analysts to work collaboratively by sharing data models and code?
- Extensive library of visualizations. Pie charts, column charts, trendlines and other basic visualizations can only take you so far. Does the BI tool feature more specialized visualizations like heat maps or radar charts? Does it allow you to build your own custom visualizations?

It pays to carefully review a range of perspectives on different tools so that you can independently evaluate the tradeoffs involved. Industry research firms often aggregate such information. Read before you leap!
Chapter 6: Getting started with data integration
There are six practical steps to getting started with data integration:
- Assess your needs
- Migrate or start fresh
- Evaluate the elements of your modern data stack
- Calculate total cost of ownership and ROI
- Establish success criteria
- Set up proof of concept
Assess your needs
You might not want to outsource your data operations to a third party or a cloud.
The first and most obvious reason is that your organization may be very small or operate with a very small scale or complexity of data. You might not have data operations at all if you are a tiny startup still attempting to find product-market fit. The same might be true if you only use one or two applications, are unlikely to adopt new applications, and your integrated analytics tools for each application are already sufficient.
A second reason not to purchase a modern data stack is that it may not meet certain performance or regulatory compliance standards. If nanoseconds of latency can make or break your operations, you might avoid third-party cloud infrastructure and build your own hardware.
A third reason is that your organization is in the business of producing its own specialized software products, and using or selling the data produced by their software. What if you are a streaming web service that produces terabytes of user data every day and also surfaces recommendations for users? Even so, your organization may still outsource data operations for external data sources.
Otherwise, if your organization is of a sufficient size or maturity to take advantage of analytics, and data refresh cycles of a few minutes or hours are acceptable, proceed.
Migrate or start fresh
Data integration providers should be able to migrate data from old infrastructure to your new data stack, but the task is a hassle because of the intrinsic complexity of data. Whether your company decides to migrate or simply start a new instance from scratch depends heavily on how important historical data is to you.
It may be costly to end existing contracts for products or services. Beyond money, familiarity with and preference for certain tools and technologies can be an important consideration.
Take care that prospective solutions are compatible with any products and services you intend to keep.
Evaluate the elements of your modern data stack
You will need a data integration tool, data warehouse, business intelligence platform, and transformation layer. Refer to the previous chapter for the exact criteria you should use to evaluate your choices, and make sure the technologies are compatible with each other.
Calculate total cost of ownership and ROI
The modern data stack promises substantial savings of time, money and labor. Compare your existing data integration workflow with the alternatives.
Calculate the cost of your current data pipeline, which might require a careful audit of prior spending on data integration activities. You’ll need to consider the sticker price, costs of configuring and maintaining, and any opportunity costs incurred by failures, stoppages and downtime. You should also consider the costs of your data warehouse and BI tool.
On the other side of the ledger, you will want to evaluate the benefits of the potential replacement. Some may not be very tangible or calculable (i.e., improvements in the morale of analysts), but others, such as time and money gains, can be readily quantified.
Establish success criteria
An automated data integration solution can serve a number of goals. Base your success criteria off the following:
- Time, money and labor savings – A modern data stack should dramatically reduce your data engineering costs by eliminating the need to build and maintain data connectors. Labor savings may amount to hundreds of hours of engineering time per week, with the corresponding monetary figures.
- Expanded capabilities – A modern data stack (MDS) should expand the capabilities of your data team by making more data sources available without additional labor.
- Successful execution of new data projects, such as customer attribution models – More time and data sources allow your team to build new data models, including those that track the same entities across multiple data sources.
- Reduced turnaround time for reports – A modern data stack should dramatically shorten the turnaround time for reports, ensuring that key decision-makers stay up-to-date.
- Reduced data infrastructure downtime – A modern data stack should dramatically improve reliability and virtually eliminate your maintenance burden.
- Greater business intelligence usage – By combining automated data integration with a modern, intuitive BI tool, a modern data stack should promote data access, literacy and usage across your organization.
- New available and actionable metrics – With additional data sources and an easy-to-use BI tool, a modern data stack should enable new metrics and KPIs for decision-making.
Set up a proof of concept
Once you have narrowed your search to a few candidates and determined the standards for success, test the products in a low-stakes manner. Most products will offer free trials for a few weeks at a time.
Set up connectors between your data sources and data warehouses, and measure how much time and effort it takes to sync your data. Perform some basic transformations. Set aside dedicated trial time for your team, and encourage them to stress-test the system in every way imaginable.
Compare the results of your trial against your standards for success.
Good luck!
[CTA_MODULE]
Related blog posts
Start for free
Join the thousands of companies using Fivetran to centralize and transform their data.


