


Businesses analyze data to better understand their customers, identify new opportunities, and make better decisions. In order to analyze data, data must first be organized and structured in a manner that can be easily interpreted by analysts and formed into dashboards, reports, and predictive models. Data is a business asset, but only if you can make use of it. Like ore in an underground lode, it’s worth much more after it’s mined, refined, and fashioned into something useful.
In a business setting, the ore is data that lives in business applications — Salesforce, Google Analytics, and more. To realize its value, you have to extract the data and load it into a repository from which you can derive business intelligence.
That’s what ELT software does: It extracts data from hundreds of different source systems, loads it into a data warehouse or data lake, and transforms it into shape for use in analysis.
Contents
Chapter 1: What is data transformation?
Chapter 2: Data transformation techniques
Chapter 3: Where Fivetran fits in
What is data transformation?
Data transformation is the process of revising, computing, separating and combining raw data into analysis-ready data models. Data models are representations of reality that can be readily turned into metrics, reports and dashboards to help users accomplish specific goals. In particular, businesses need KPIs and other metrics in order to quantify and understand what and how they are doing.
Transformation prepares data for a range of use cases, including:
- Analytics – Analytics for supporting decisions starts with metrics. Sometimes, metrics can be computed from a single source and only need a modest amount of transformation. Other times, the only way to compute a metric is to combine data from a wide range of sources and then aggregate it.
- Machine learning – Machine learning is automated pattern recognition. Business applications of machine learning include revenue and profit projections, predictive modeling to support major decisions, systems to recommend products for customers and all kinds of business process automation.
- Regulatory compliance – Needlessly storing personal identifiable information (PII) leaves sensitive data vulnerable to a range of accidental and malicious data breaches. Data breaches compromise the privacy of your data and create serious problems both for you and your customers.
Data transformation techniques
Raw data is seldom structured or formatted in a way that serves the use cases listed above. Some common examples of transformations that make data more readily useful include the following.
Revising
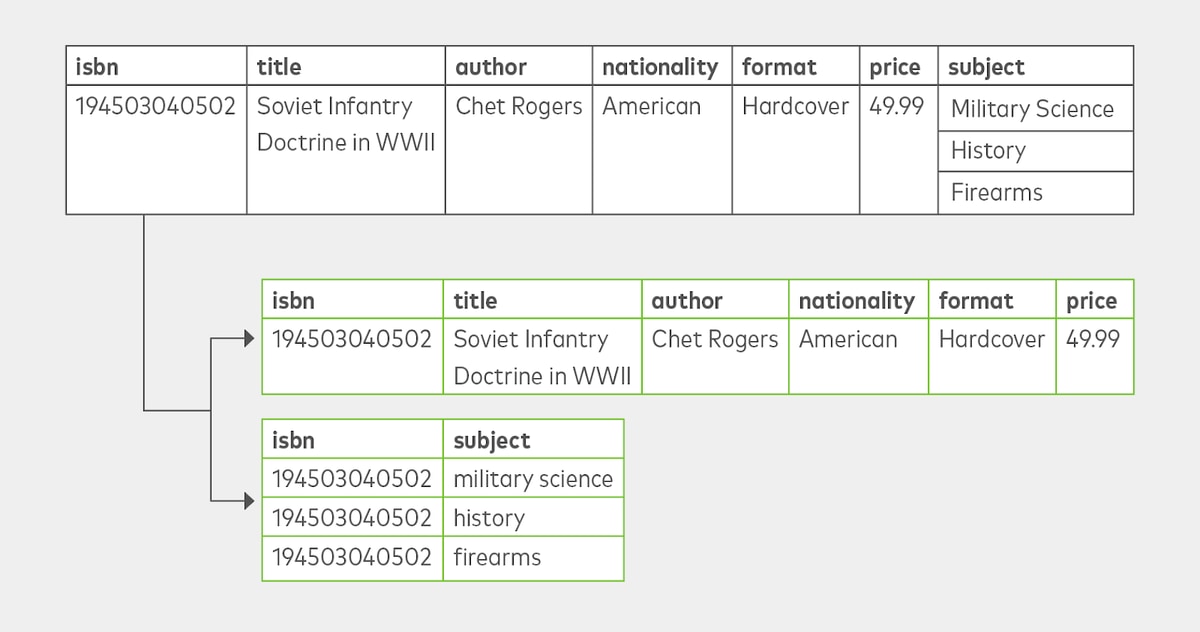
Revising data ensures that values are correct and organized in a manner that supports their intended use.Database normalization is one form of revising data by reducing a data model to a “normal” form without redundancies or one-to-many values in a column. Normalization reduces storage needs and makes a data model more concise and more legible to analysts. However, it is very labor-intensive, requiring a great deal of investigation, reverse engineering and critical thinking.
Data cleansing converts data values for formatting compatibility.
Format revision/conversion replaces incompatible characters, converting units, converting date formatting and otherwise changing data types.
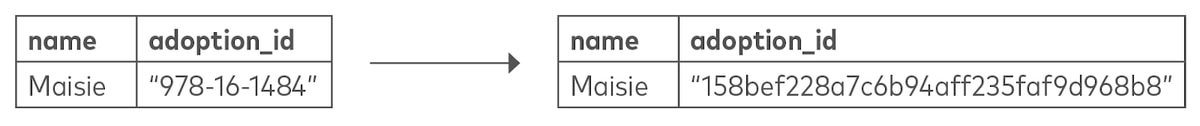
Key restructuring creates generic identifiers out of values with built-in meanings, so they can be used as fixed, unique keys across tables.
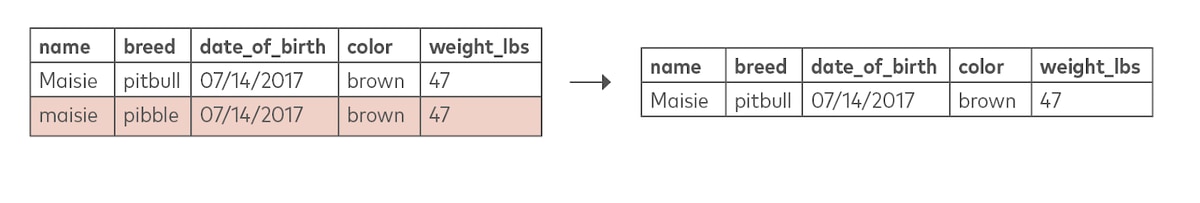
Deduplication means identifying and removing duplicate records.
Data validation evaluates the validity of a record by the completeness of the data, usually by excluding incomplete records.
Removing unused and repeated columns allows you to select the fields you want to use as features, i.e. the input variables to a predictive model. It can also improve the performance and overall legibility of a model.
Computing
A common use case for computing new data values from existing data is to calculate rates, proportions, summary statistics and other important figures. Another is to turn unstructured data, such as from media files, into structured data that can be interpreted by a machine learning algorithm.
Derivation includes simple cross-column calculations.
Summarization consists of using aggregate functions to produce summary values.
Pivoting turns row values into columns and vice-versa.
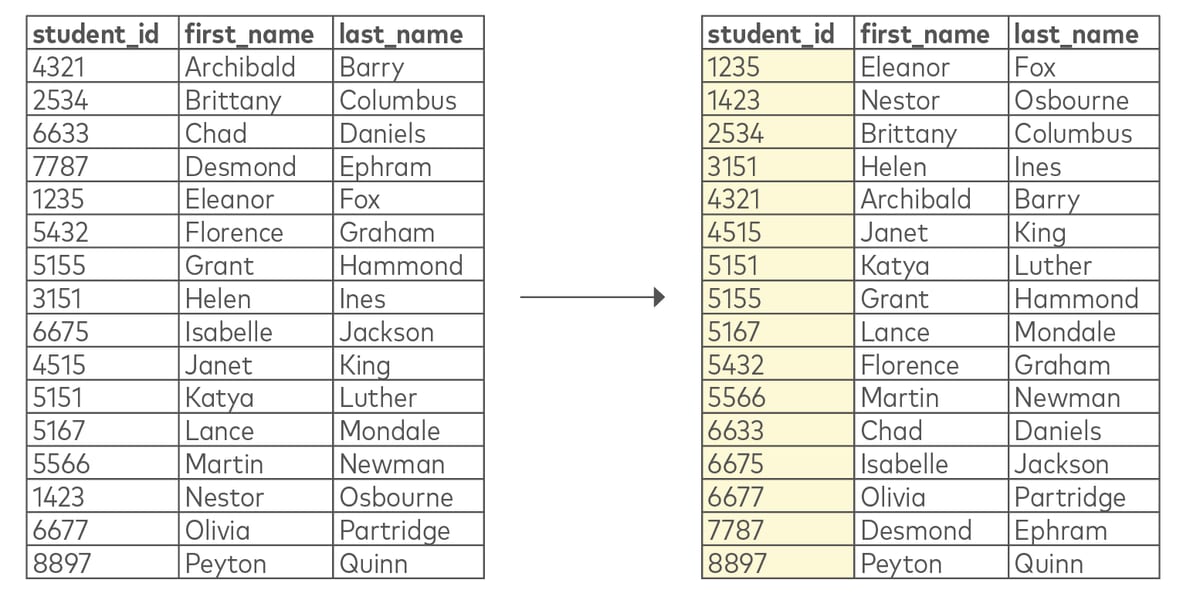
Sorting, ordering and indexing organize records in some ordinal manner to improve search performance
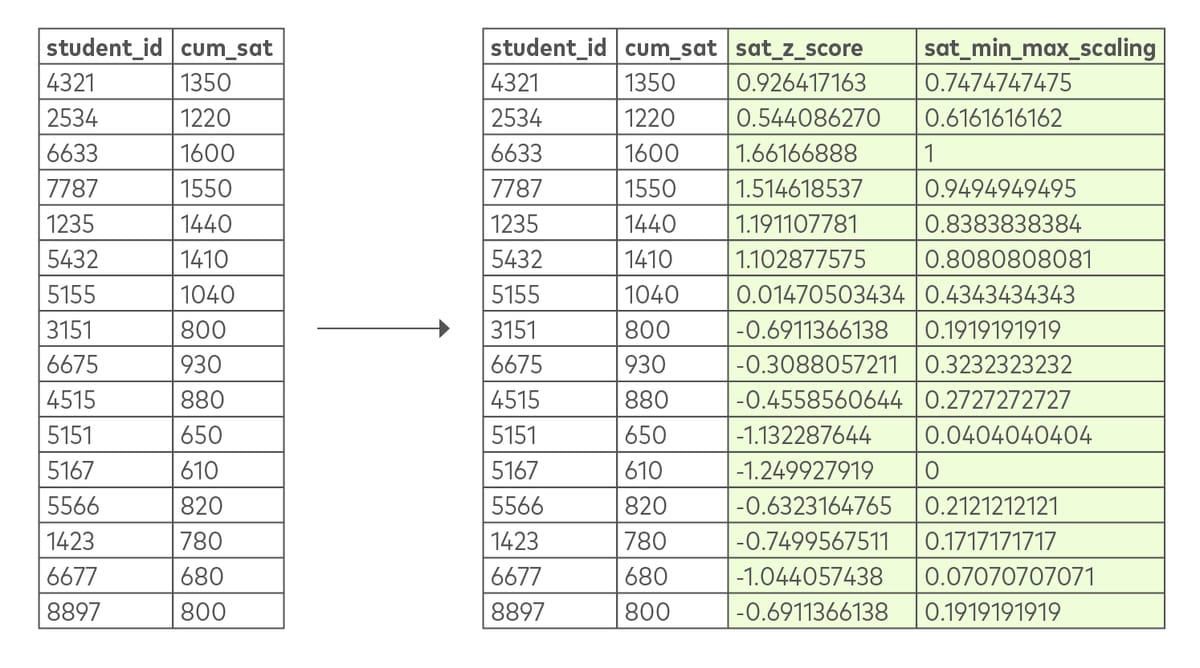
Scaling, standardization and normalization put numbers on a consistent scale, such as fractions of a standard deviation in Z-score normalization. This allows dissimilar numbers to be compared with each other.
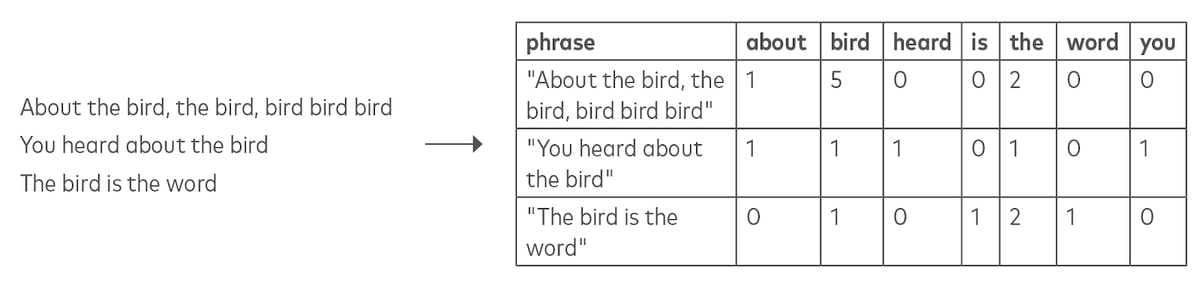
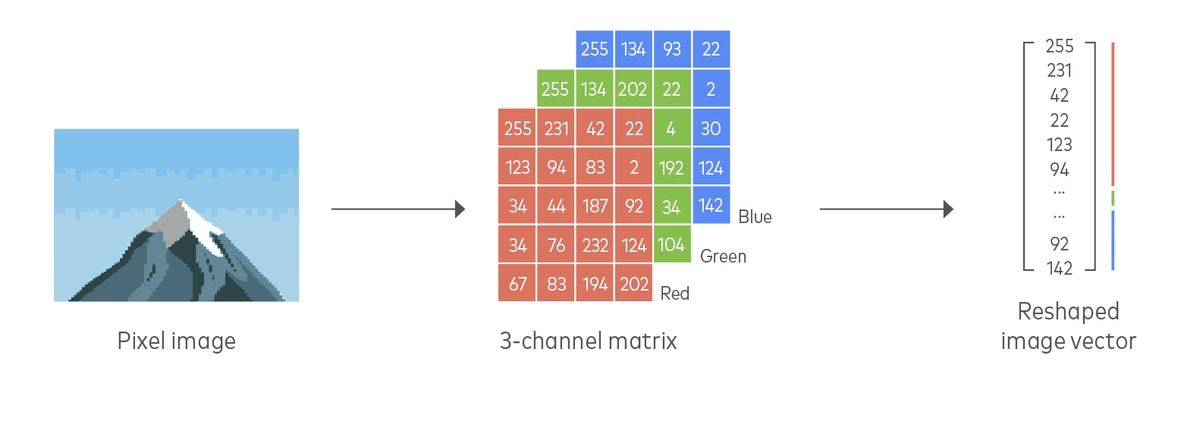
Vectorization converts non-numerical data into arrays of numbers. There are many machine learning applications of these transformations, such as for natural language processing (NLP) and image recognition.
One example of vectorization is converting song lyrics into a “bag of words,” or a series of records consisting of word counts.
Another example is converting an image into a matrix of RGB values that represent the color value of the pixels in the image.
Separating
Separating consists of dividing values into their constituent parts. Data values are often combined within the same field because of idiosyncrasies in data collection, but may need to be separated to perform more granular analysis.
Splitting a single column into multiple columns is often used for fields containing delimited values, or for converting a column with multiple possible categorical values into dummy variables for regression analysis.
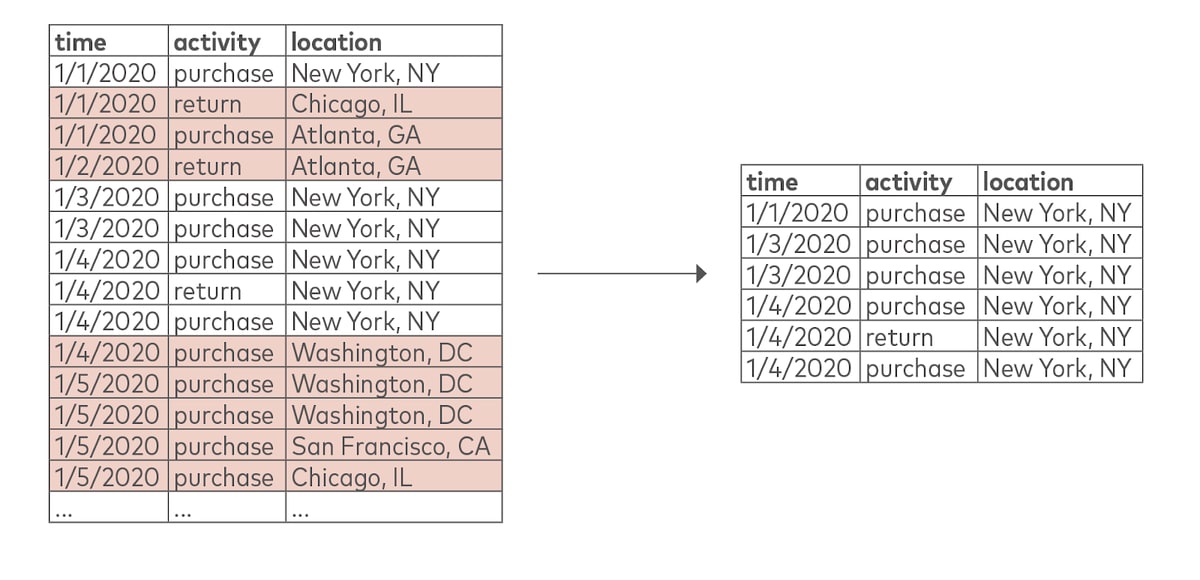
Filtering excludes data on the basis of certain row values or columns.
Combining
A common and important task in analytics is to combine records from across different tables and data from multiple sources in order to build a full picture of an organization’s activities.
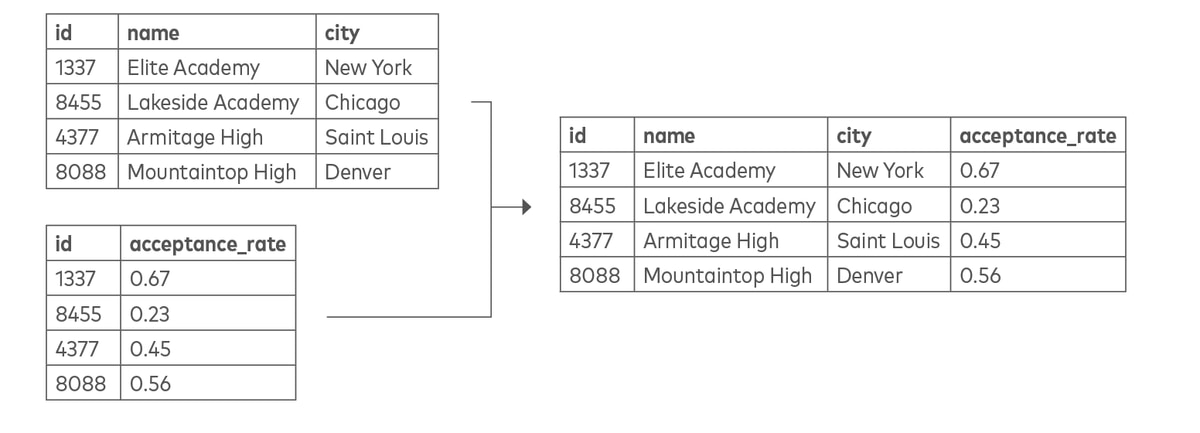
Joining is the act of linking data across tables.
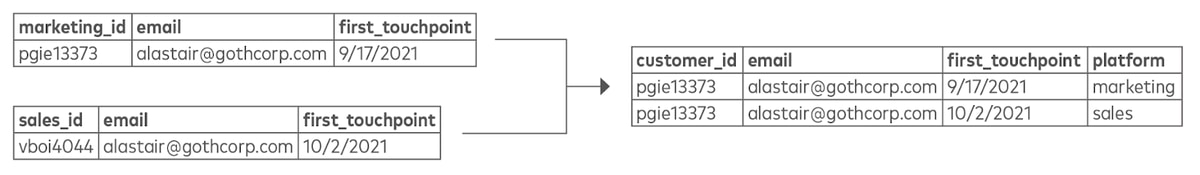
Merging, which is also known as appending or union, combines records from multiple tables. By blending the two tables using a common column, such as “email” in the example below, you can assemble parts of the sales and marketing funnel. This is also an example of integration, which consists of reconciling names and values for the same data element across different tables.
The examples listed above illustrate how additional processing is nearly always required to turn raw data into usable data models. Transformations themselves are a key part of a broader process called data integration, without which analytics and data science are impossible.
Where Fivetran fits in
Fivetran automatically addresses many of the common issues that data professionals face with transformations. In addition to moving data by scheduling extracts from your data sources, Fivetran automatically creates and manages schemas and data types appropriately for your destination. This creates tables that are immediately ready to query in your data warehouse or data lake.
In addition, Fivetran offers data transformation tools such as column blocking and hashing to exclude or anonymize sensitive data and an extensive library of data models that can be readily applied to our supported data sources.
Download "The Ultimate Guide to Data Transformation" for an in-depth look on this topic.


